This May, Aclima and San Diego County announced a partnership to bring hyper-local air quality data and insights to San Diego communities, regulators, and policymakers. Aclima’s air quality mapping and analysis platform provides next-generation diagnostics of critical air pollutants and greenhouse gases at block-by-block resolution. Today, we are giving the public visibility into air quality in their neighborhoods on our website. This is a first step towards making air pollution visible to San Diegans where they live, work, play and learn, so they can take action to improve air quality and protect their health.
Mapping hyper-local air quality in San Diego
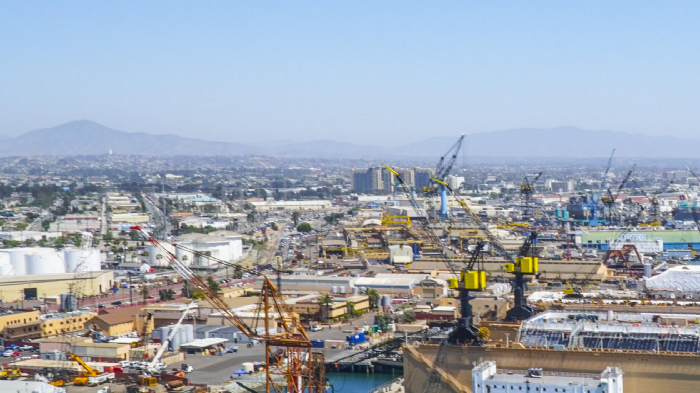
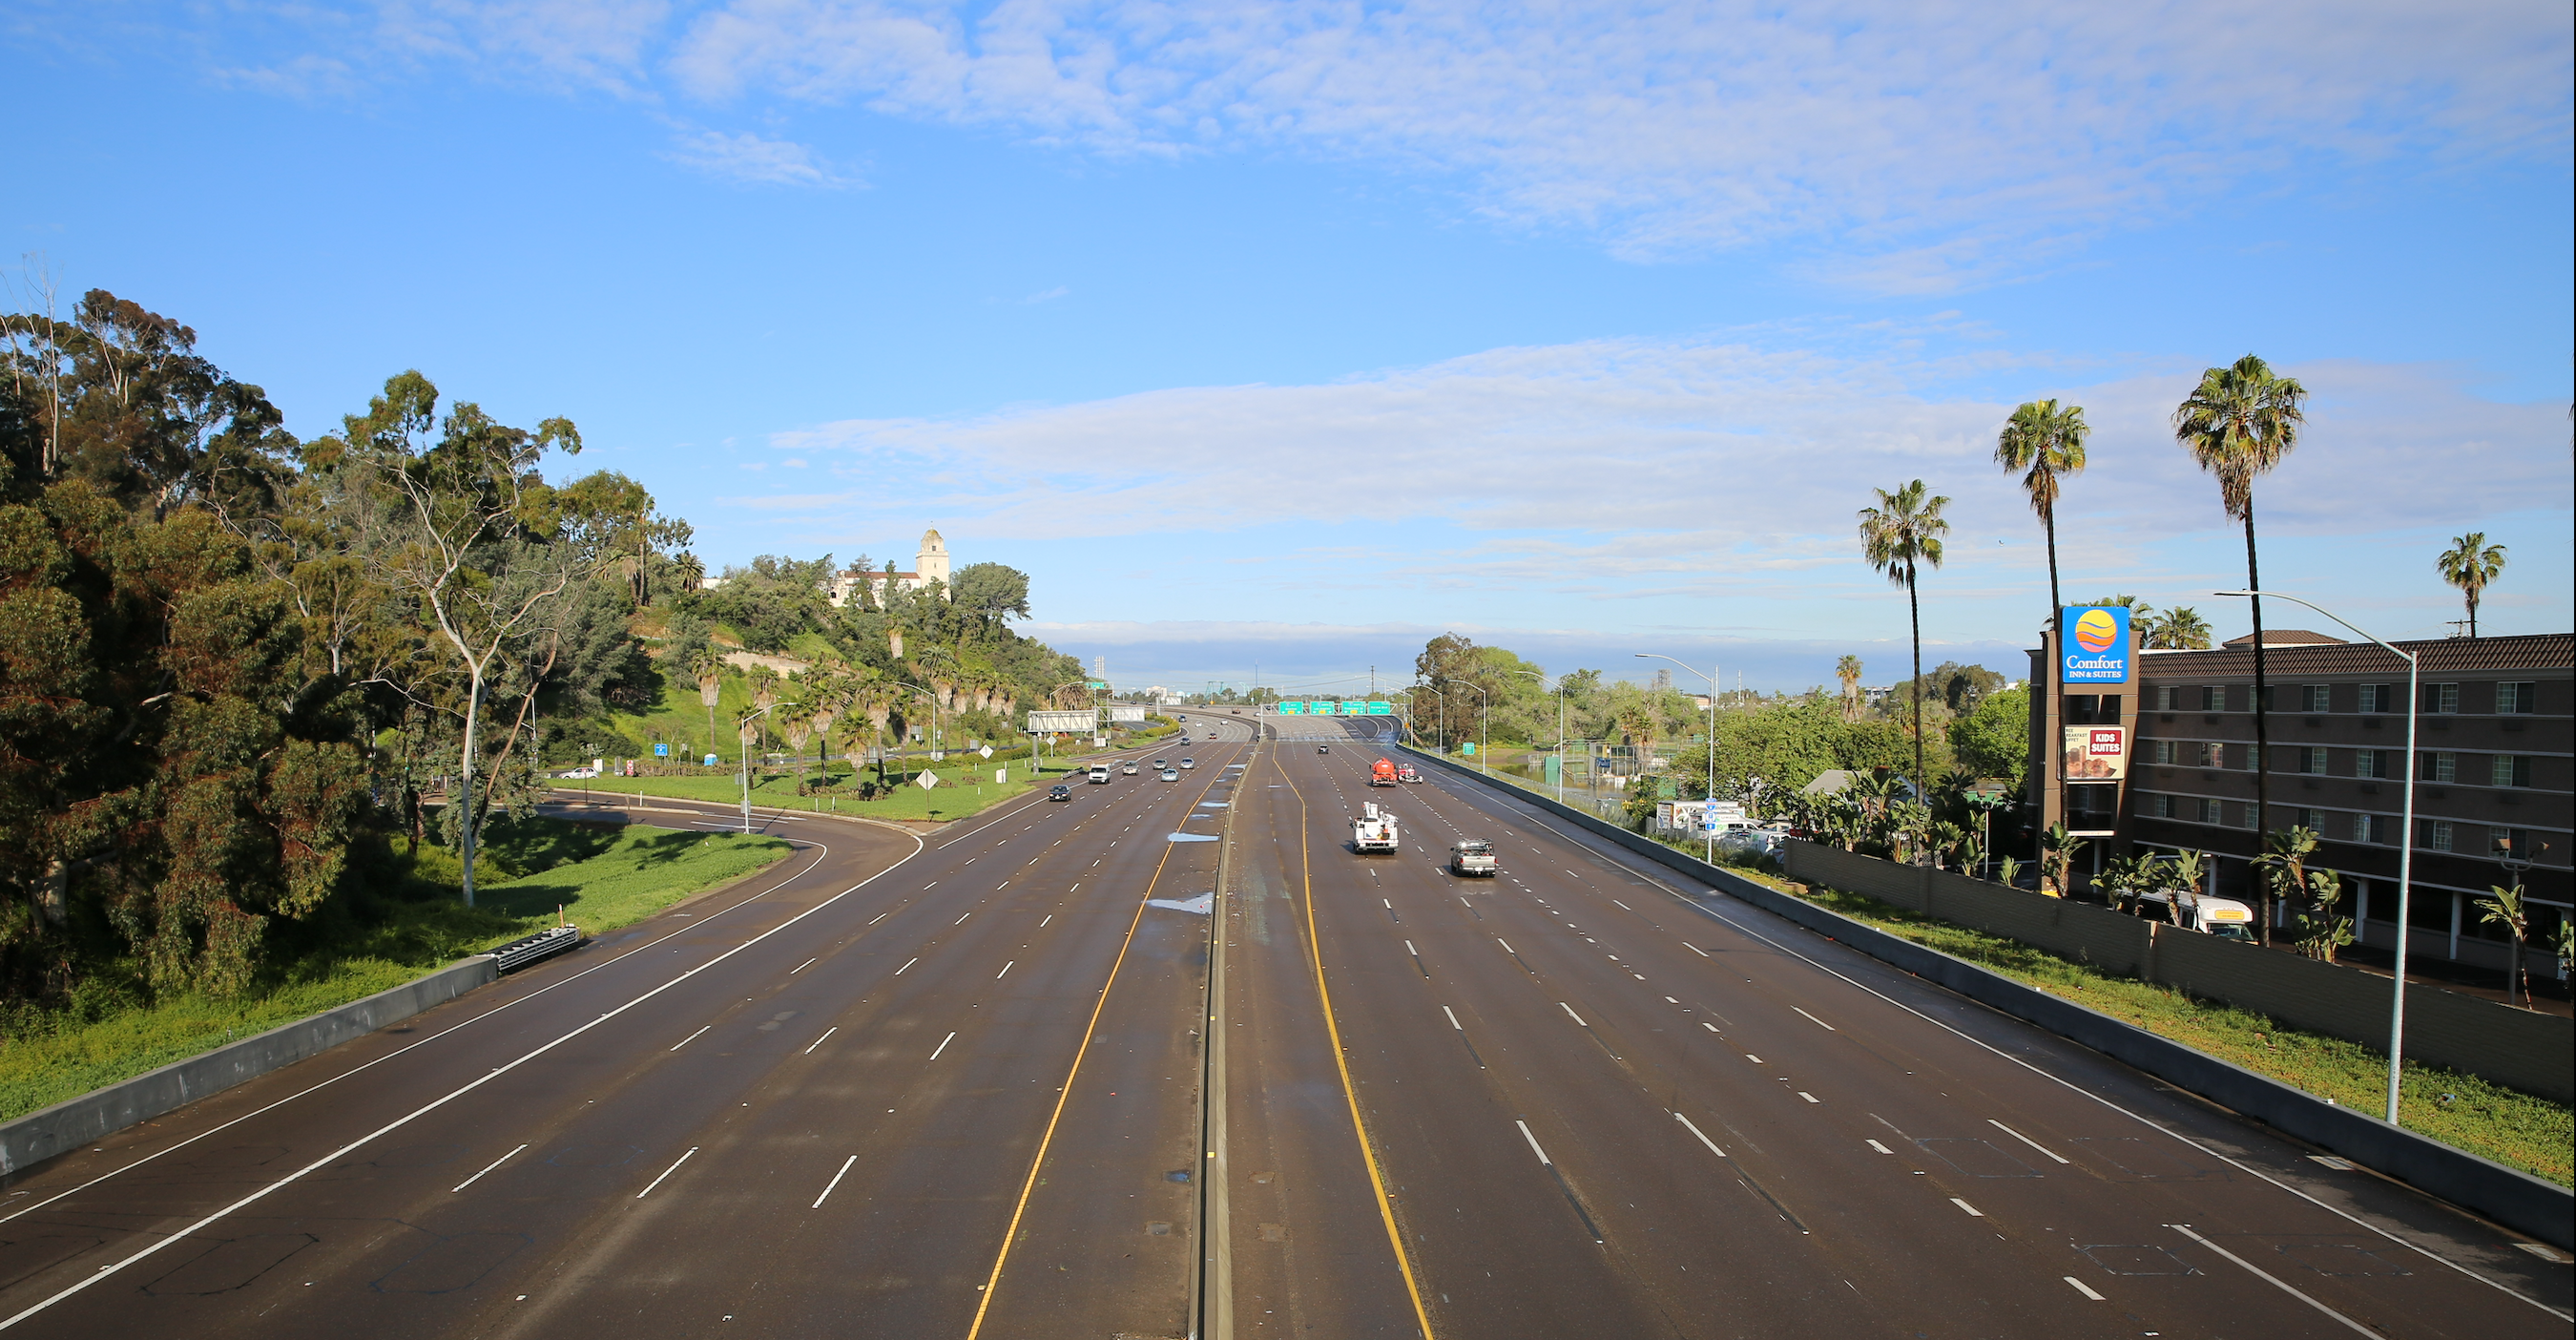
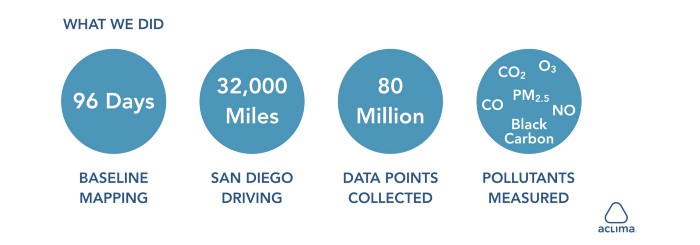
Our first baseline maps in San Diego County were generated between March 1 and June 4, 2019. We have been measuring a variety of air pollutants on the streets and highways, at ground level, in several San Diego communities — we call this hyper-local monitoring and it’s the first time this has been done. This mapping includes measurements of carbon dioxide (CO2), carbon monoxide (CO), nitric oxide (NO), ozone (O3), particulate matter (PM2.5), and black carbon. In order to collect enough data to be scientifically-significant, we drove over 32,000 miles with our air quality sensor-equipped vehicles, covering 47 square miles across several San Diego communities including Barrio Logan, National City, Sherman Heights, Chula Vista, Otay Mesa, and San Ysidro.
Driven with care by members of the community, Aclima’s low-emission cars are equipped with our cutting-edge mobile air quality sensor devices. As the cars drive each street, they continuously collect and map air quality and greenhouse gas levels. The resulting data provides a block-by-block view of air quality that enables people to see pollution and greenhouse gas concentrations near their home, school, work, and other places they visit regularly.

Working to complement air pollution measurement and reduction efforts in San Diego
Aclima’s mobile air monitoring provides rich geospatial hyper-local data that complements measurements collected by stationary regulator monitors. In San Diego, regulatory stationary monitors are run by the San Diego Air Pollution Control District and are great for tracking changes over time in their locations. To understand the air quality that people experience in their daily lives, we need to capture hyper-local measurements of average concentrations at many locations. We do this by driving through each location many times on different days of the week and at different times. Our research has shown that averaging these repeated measurements creates a representative picture of air pollution at a block-by-block resolution, resulting in what we refer to as a baseline map.
In June, Aclima delivered the maps from our hyper-local measurements to the County and the Community Steering Committee in San Diego. The San Diego Air Pollution Control District is now using Aclima’s maps of environmental justice communities to support air quality monitoring and emissions reduction efforts required by the State of California’s groundbreaking legislation, AB 617: The Community Air Protection Program. Aclima’s rich dataset and tools will help the County identify key sites for additional stationary measurement, and prioritize emission reduction initiatives and policy interventions that reduce exposure in the communities most impacted by air pollution.
This hyperlocal data is giving that information. We’re getting a better understanding of how residents are being impacted by air pollution. It’s quite a step forward, and we’re excited about it.”— Jon Adams, Assistant Director, San Diego Air Pollution Control District
Jon Adams, Assistant Director with the San Diego Air Pollution Control District, explained the significance of block-by-block data for the County. “Historically, air quality data has been done on a regional basis, away from factories, away from mobile sources. Never has there been data collected at the community level, at the street level. ‘What is a resident being impacted by?’ This hyperlocal data is giving that information. We’re getting a better understanding of how residents are being impacted by air pollution. It’s quite a step forward, and we’re excited about it.”
Air quality data visualization for community members
Today, we are excited to make hyperlocal air quality insights publicly accessible and searchable through a new visualization tool on Aclima’s website. This interactive, online air quality map is populated with the San Diego hyper-local air quality data measured throughout Spring 2019. We designed this web application in collaboration with environmental justice advocates so that people can better understand hyper-local air quality, and the actions they can take to protect themselves from exposure to air pollution.
With this new online tool, residents in mapped neighborhoods can look up the average air quality for their street and understand how it compares to other points of interest in their community. The tool also lays out what each pollutant means and its impacts on human health and the planet. Through the tool, users can share their findings on social media, and find an action kit with resources from the State and local San Diego County Pollution Control District, as well as environmental justice community organizations.
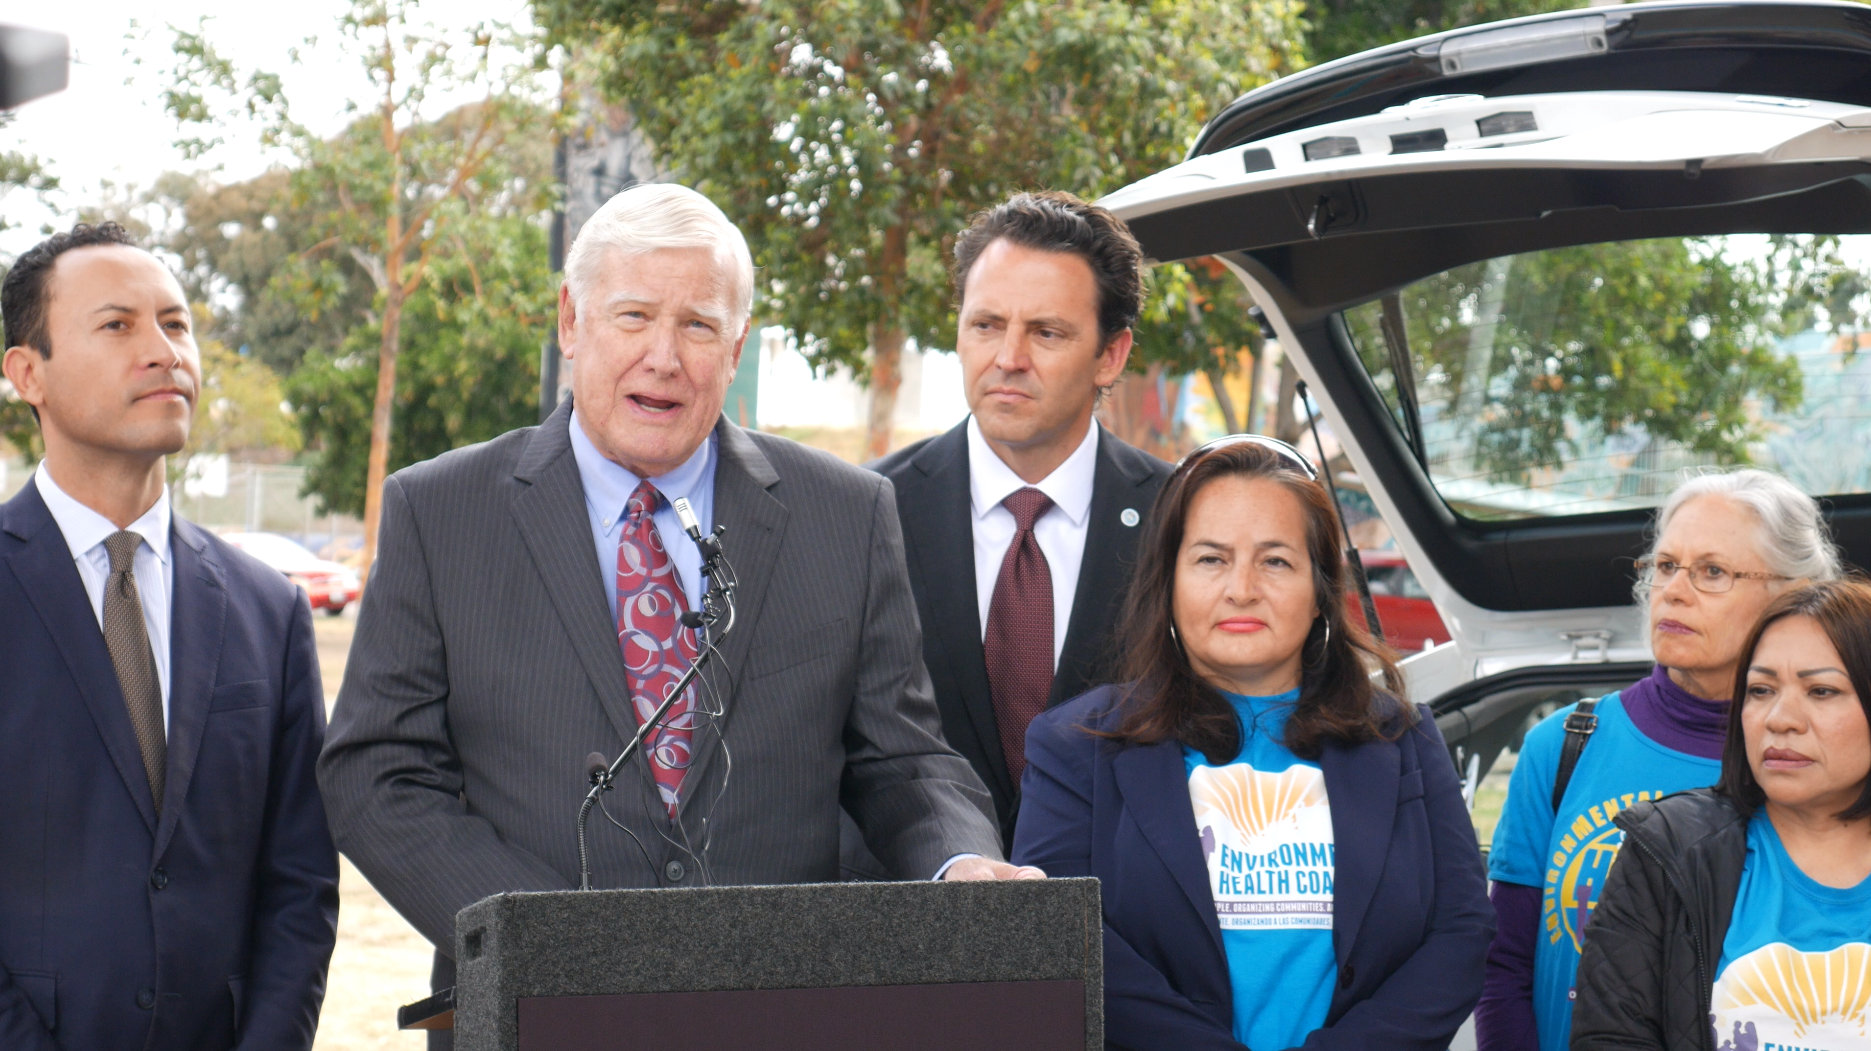
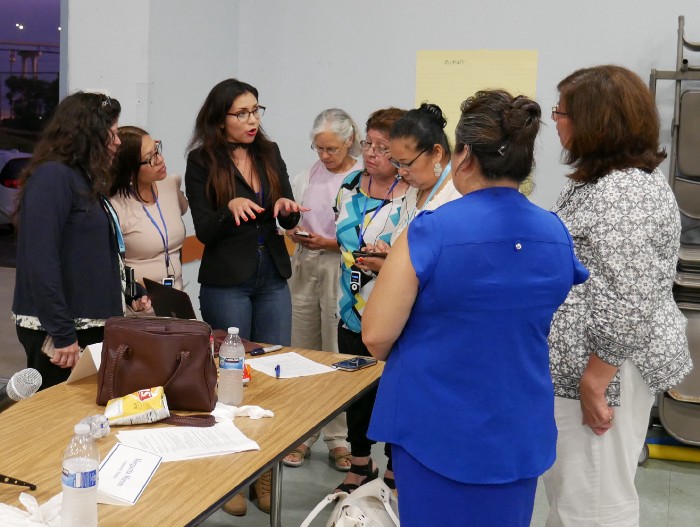
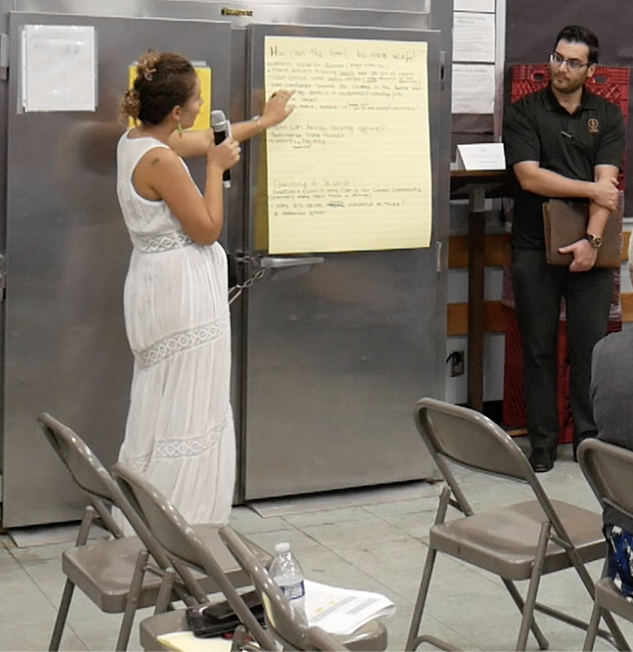
On Tuesday, August 27, we launched the site at the monthly steering committee meeting for the portside environmental justice neighborhoods in San Diego. The audience was diverse, representing all ages, professions and cultural backgrounds. Part of the meeting involved breaking out into small groups where everyone had an opportunity to dive into Insights, and brainstorm ideas for future versions of the application. We focused on ways the application can amplify existing air quality improvement efforts underway in the community, and how we can make it even more powerful for the public’s use and understanding.
Sandy Naranjo, the California Organizing Manager at Mothers Out Front and member of the AB 617 Steering Committee, shared the importance of access to knowledge on air quality in their neighborhoods:
“It’s very pivotal to have air monitoring because we need to know ‘what are the sources of the air pollution?’ Having that data helps the community make decisions and talk to our elected officials to make policy to eliminate air pollution.”
Next steps
The Aclima team is excited to be taking this first step in surfacing hyper-local air quality information to air quality regulators and the public in San Diego. We value the feedback from everyone on the steering committee and look forward to working together to inform and empower collective action to reduce exposure and improve local air quality. While this is just the beginning of our larger mapping efforts, this week’s launch in San Diego serves as an example of what informed collaboration between citizens, government and the private sector can do to address air pollution across California and around the globe.