Our cities and buildings are dynamic, living systems. Millions of residents go about their lives making transportation and energy choices, like riding bikes through the park or sitting in traffic. Adding weather to this mix of individual and collective activities creates shifts in air quality patterns throughout a day, a week, months, or years.
Gone are the “Smogtown” days, but Los Angeles still grapples with chronic air quality problems caused by millions of cars and trucks, the region’s diverse commercial and industrial businesses, and large stationary sources like power plants. Efforts at the city, regional, and state level have helped to move the air basin towards fewer Spare the Air days. The hyperlocal data produced by our mobile system helps these efforts by identifying problematic hot spots not captured by regional monitoring, visualizing patterns on the neighborhood and community scale, and measuring the efficacy of pollution-reduction solutions at the local level where they are applied.
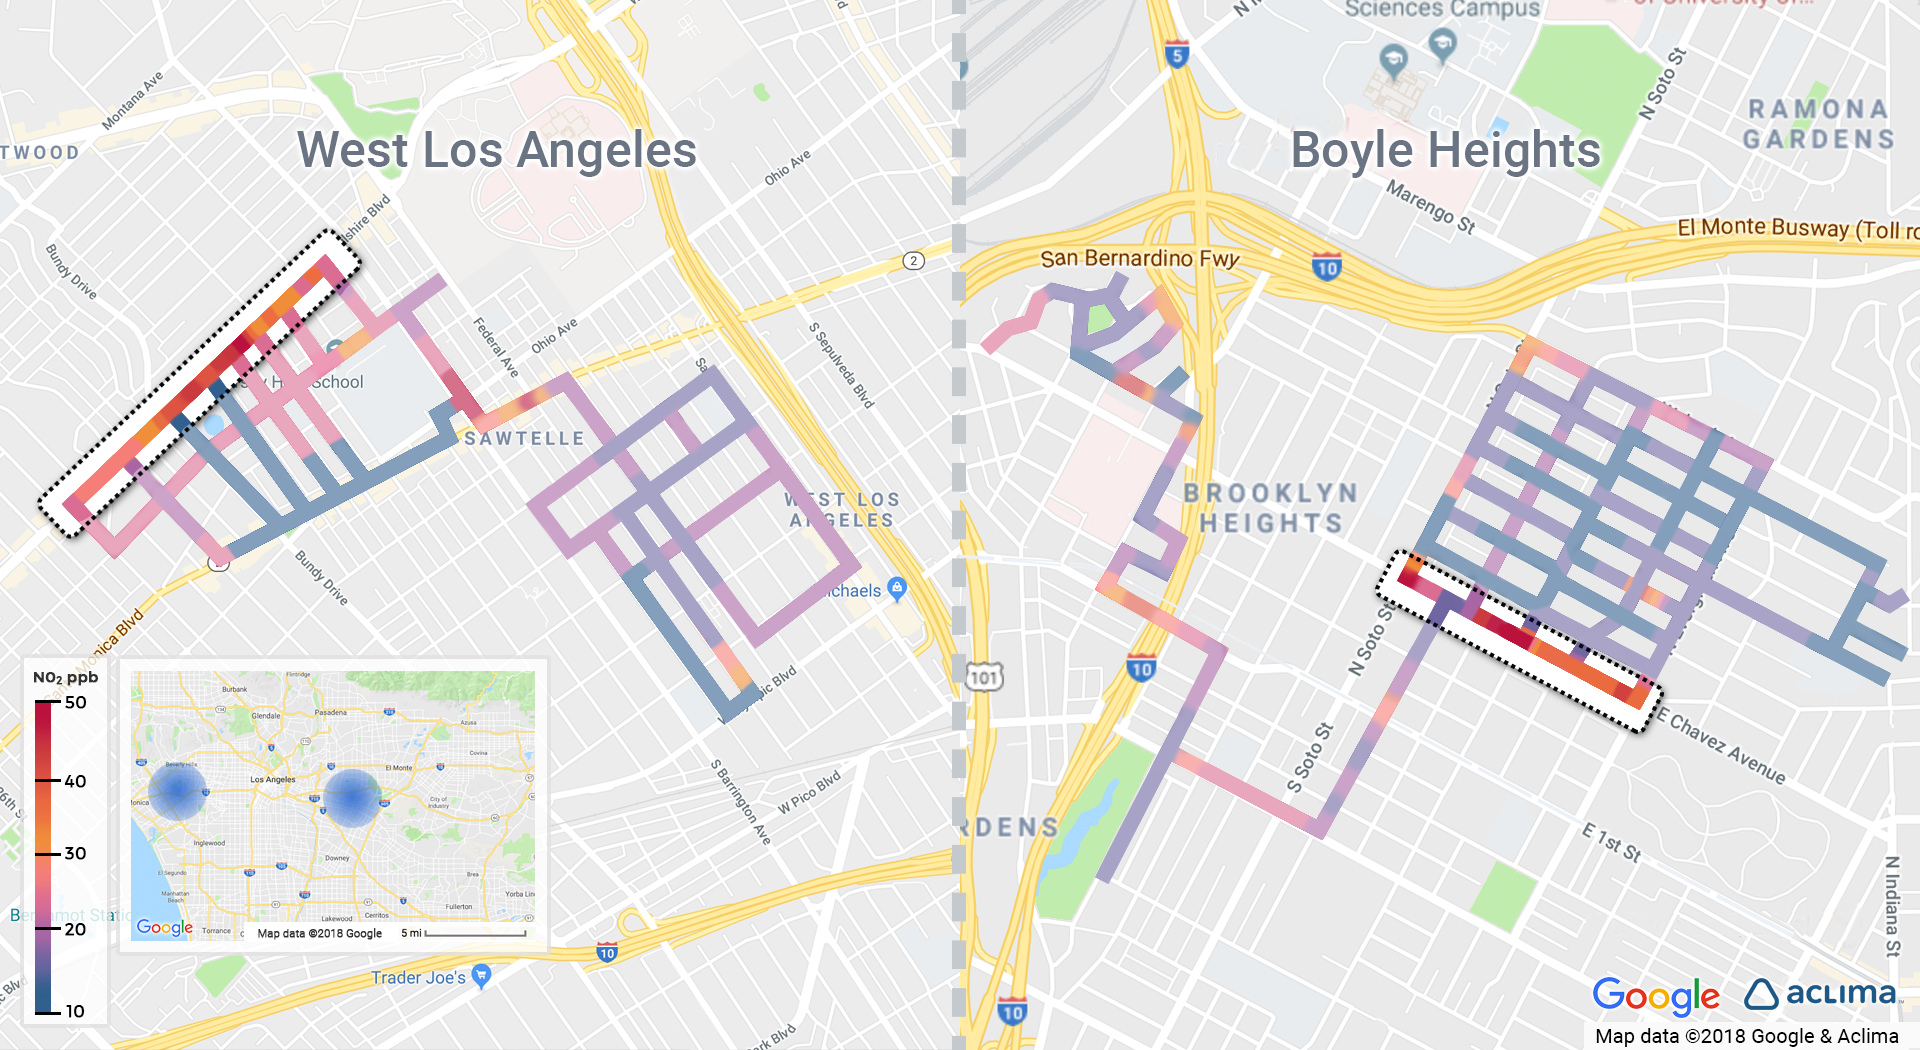
Over a three month period, we canvassed five communities in Los Angeles, ranging from urban inland neighborhoods near major freeways, residential areas near the Pacific, and communities located near the port and refinery regions. We found pollution patterns influenced by traffic-choked freeways, goods movement corridors, local traffic, and weather patterns that blow pollution inland influencing the spatial distribution of smog formed by photochemistry.
Whether you’re the parent of an asthmatic child attending school near one of LA’s iconic freeways or going for a midday run along a busy street in West LA, the 20,000 breaths we all inhale every day matter. To understand how air quality impacts us, we need more information, at a human scale and at the street level.
How We Did It
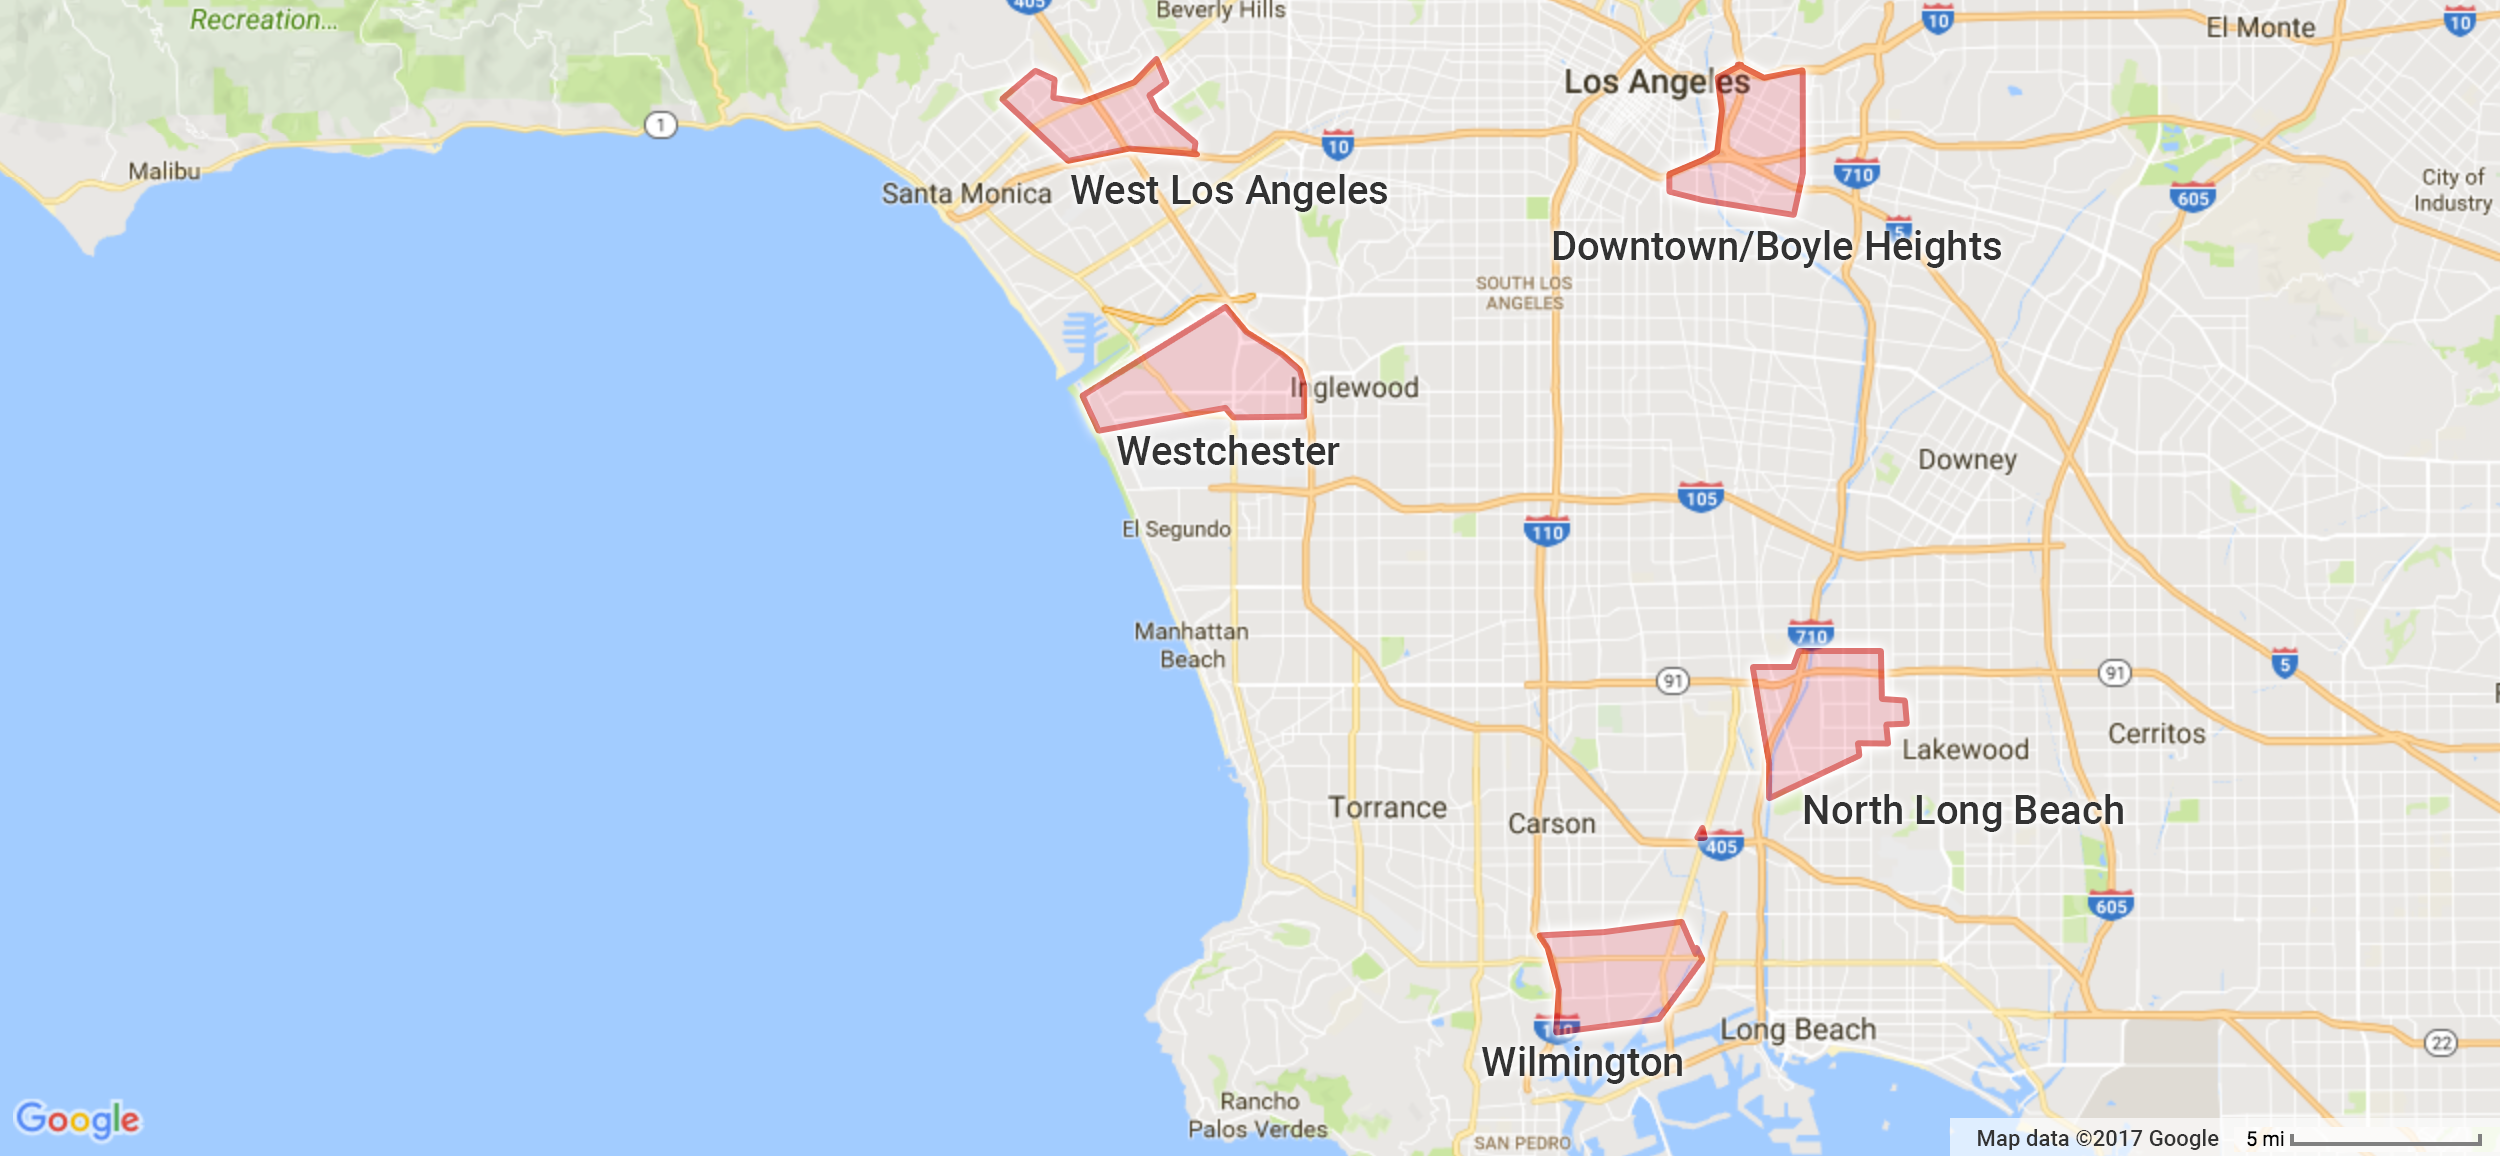
We drove in Los Angeles from September through October of 2016. We chose to focus on mapping a few key areas rather than try to canvas the whole city. Our team consulted with governmental, non-profit, and academic organizations to select communities of interest. These included Boyle Heights and Wilmington, two environmental justice neighborhoods, West Los Angeles, a neighborhood closer to the coast that is largely residential, and North Long Beach and Westchester, just north of the Los Angeles International Airport. The cars drove from Monday through Friday during typical work hours of 9:00 am to 5:00 pm. We measured the pollutants nitrogen dioxide, nitric oxide, ozone, black carbon, particulate matter, and methane.
Learn More
Stay tuned for data stories about these topics and read about why we decided to map these communities and how we did it.
Acknowledgements
We would like to thank Mayor Garcetti’s Office of Sustainability, the Los Angeles Cleantech Incubator (LACI), the South Coast Air Quality District, Ciclavia, Coalition for Clean Air; and University of Southern California’s Department of Preventive Medicine in the Keck School of Medicine for advice and support during the Los Angeles driving campaign.
Share this
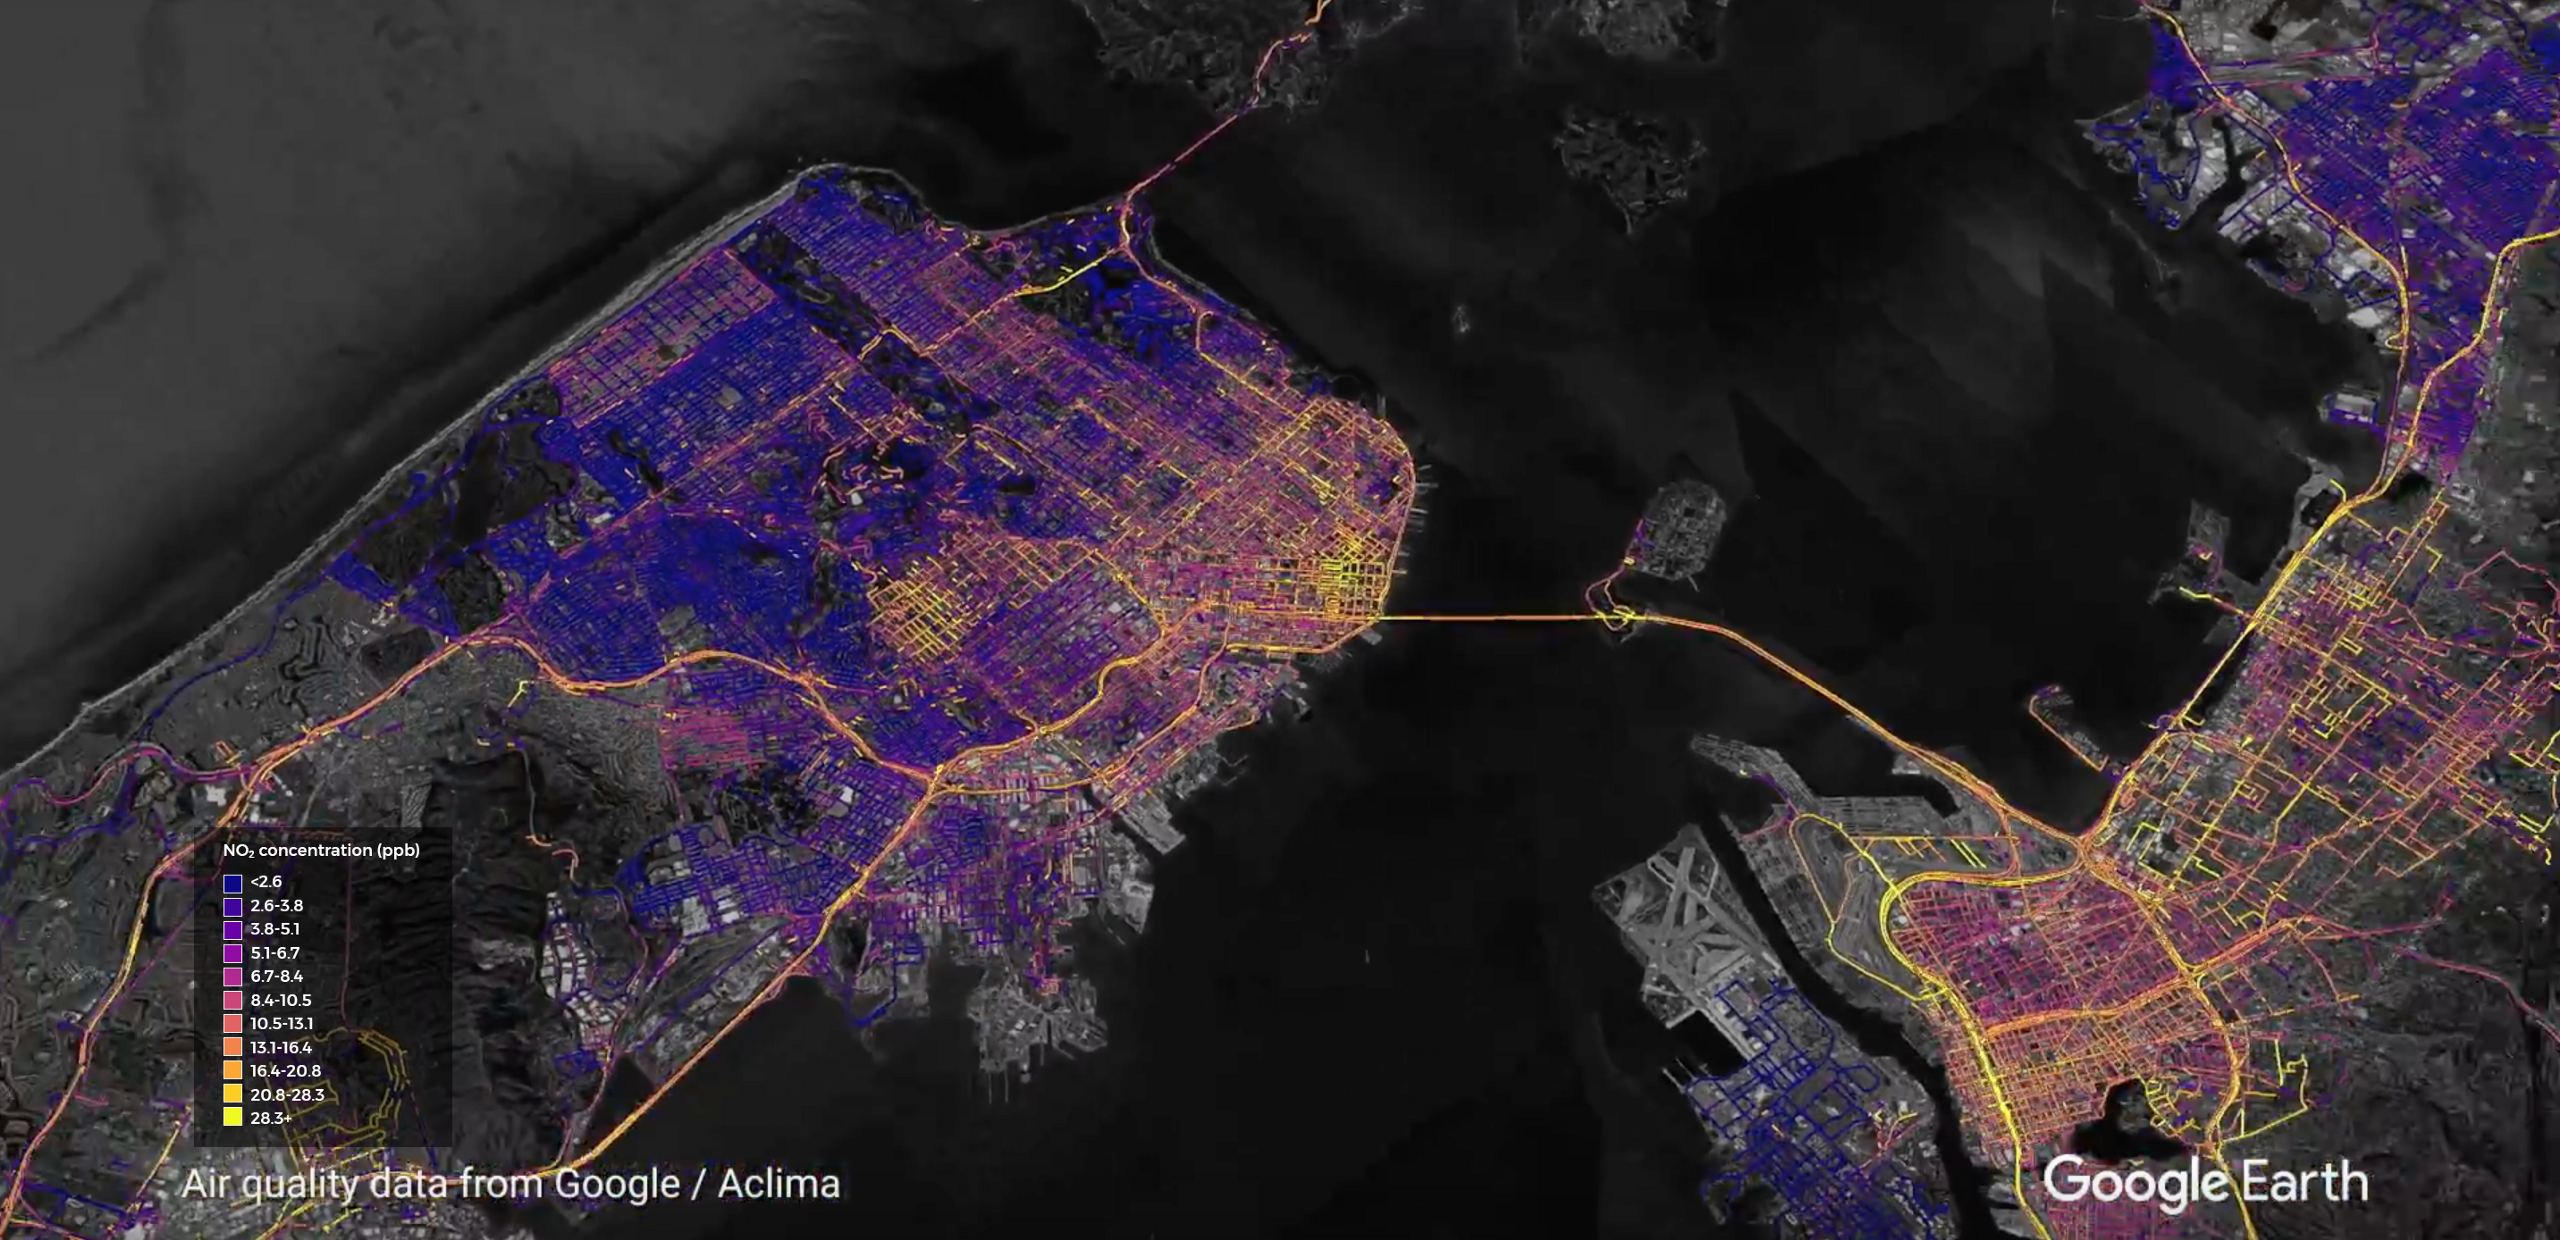
Examining Air Quality in the City by the Bay
An Earthshot Opportunity at the United Nations