First-ever Mobile Environmental Sensor Network to Span an Entire Metropolitan Region, Covering 5,000 Square Miles in 9 Counties
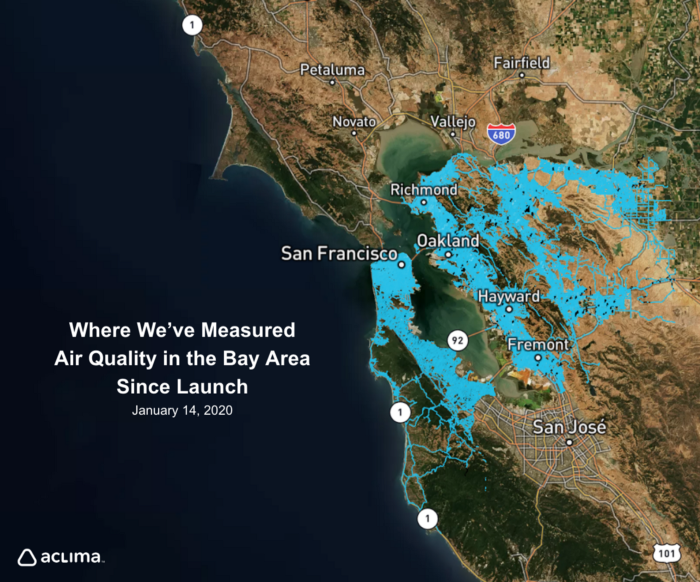
Today, as we send the first of our mapping fleet into Santa Clara County, we reach a new milestone in our work mapping air pollutants and greenhouse gases block-by-block throughout the Bay Area to protect human health and the environment.
Air pollution and climate changing emissions are causing widespread damage to human health, to our shared environment and to our economies. In our neighborhoods, levels of pollutants can be five to eight times higher from one end of a block to another. In order to diagnose and act on these hyperlocal air quality issues we need to better understand what’s happening in the air around us.
The Bay Area Air Quality Management District is committed to assuring that Bay Area residents breathe clean air, and has partnered with us to bring an unprecedented level of visibility into air pollution and climate change emissions to the region it serves. Aclima is delivering an in-depth, comprehensive picture of hyperlocal air quality in all nine counties of the Bay Area — covering more than 5,000 square miles. This is the first time a mobile environmental sensor network will be deployed across an entire metropolitan region, and will set a precedent for launching regional scale mapping around the world in the years to come.
The Air District has one of the most extensive air quality monitoring networks in the United States, with more than 30 monitoring stations throughout the region. This new layer of Aclima hyperlocal air quality data will complement regulatory stations by accurately measuring and analyzing air quality at block-by-block resolution, in the neighborhoods around and between these stations throughout the Bay Area.
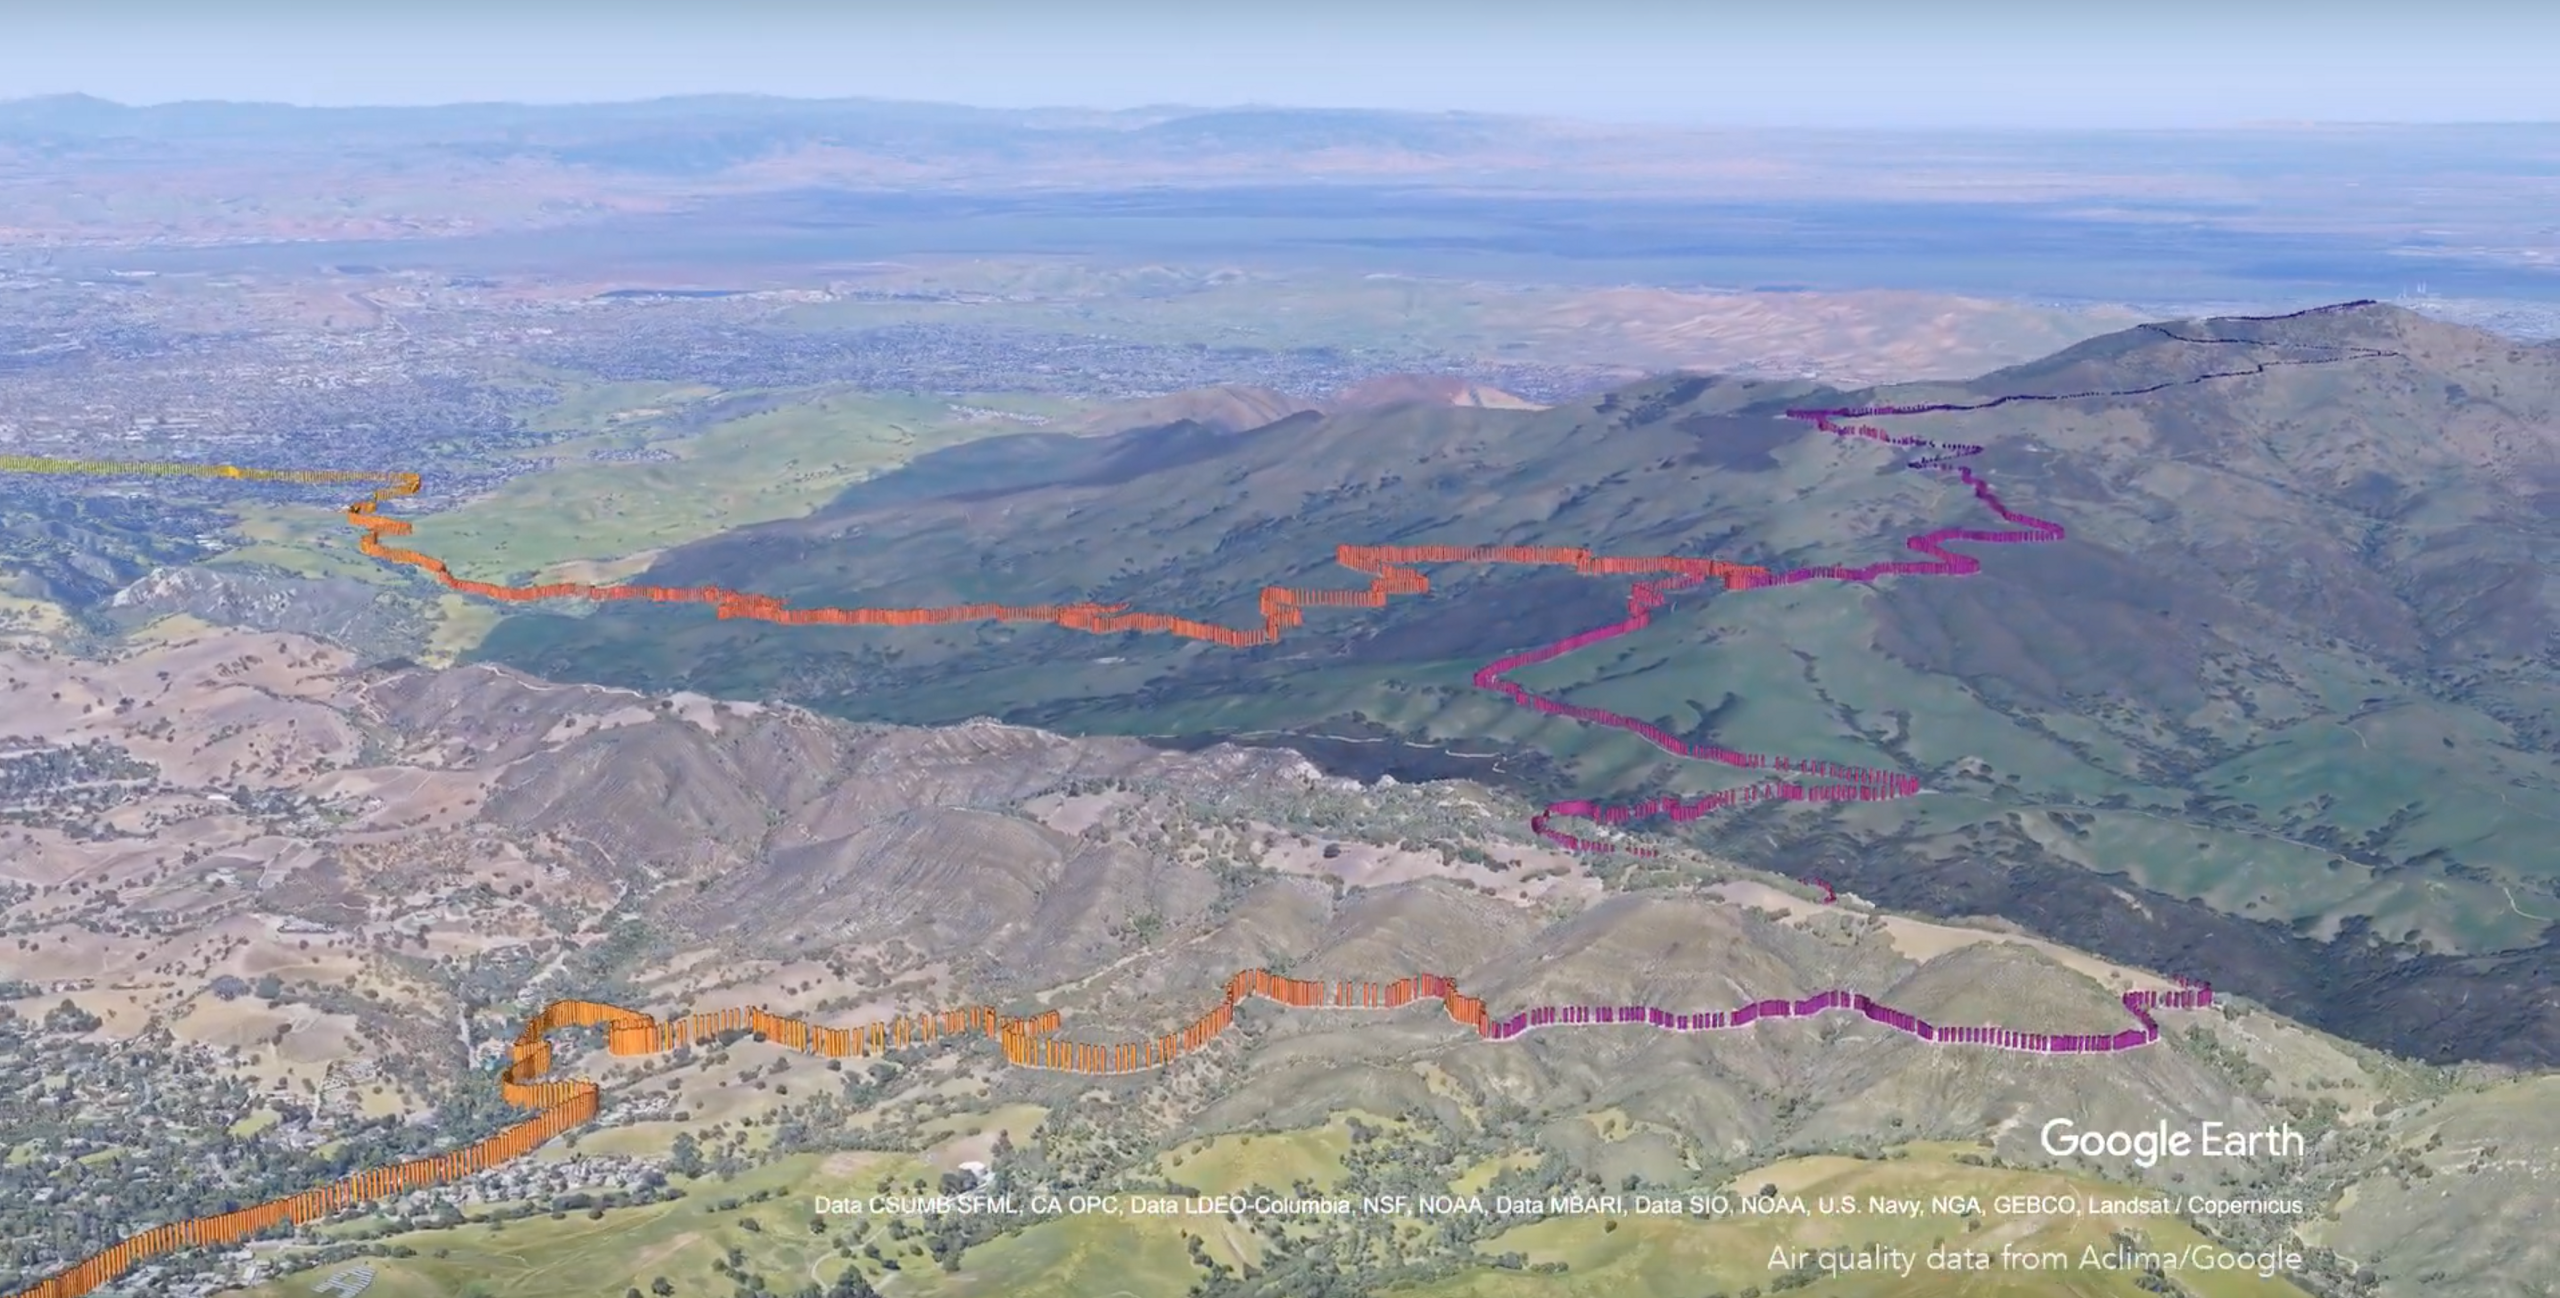
Over the next several years, our mobile sensing network will map air pollutants and climate changing emissions across the region, measuring and regularly refreshing baseline averages of block-by-block air quality across a range of pollutants including PM 2.5, ozone, and nitrogen dioxide. Aclima is systematically gathering multiple samples at varying times of day and night, on weekdays and weekends, to create a rich, dense, unparalleled dataset from which to generate a clear picture of persistent levels of pollution and emissions sources at unprecedented scale.
“This program will bring an unprecedented level of access and visibility to air quality data at the neighborhood level across the entire Bay Area region,” said Jack Broadbent, executive director for the Air District. “These innovative and powerful new tools will bring into focus the disparity of health impacts faced by many in the region and inform lawmakers to better guide the decision-making process to protect the health of all Bay Area residents.”
To support a wide range of efforts to reduce emissions and protect public health, the Air District has subscribed to Aclima Pro — a web-based application that makes the measurement data from our environmental sensor network accessible for scientific analysis and decision support. This powerful new tool identifies and diagnoses pollution hotspots, informs action, and measures the effectiveness of policies and interventions over time. To support public awareness, Aclima also makes address-based insights available to the public online.
For the past 10 years, we’ve been hard at work on the breakthrough science and technology behind our air quality mapping and analysis platform. During that time, we have designed, built and validated the hardware, software, and methodologies to deliver accurate, precise, and scientifically rigorous data. The resulting environmental intelligence informs action by governments, companies, researchers and the public to reduce emissions and protect public health, at both the local and global level.
Our fleet operations are growing quickly, and we are expanding our team of full-time drivers and driver coordinators (with benefits) throughout the Bay Area this year. In fact, we’re hiring across the board, including for engineering, design, data science, business and community engagement roles.
We’ve already begun mapping in Alameda, Contra Costa, San Francisco and San Mateo counties, starting with the Richmond-San Pablo area which will have access to maps of block-by-block air quality early this year. Today, we’re launching mapping in Santa Clara County. Immediately following that, we will expand into Marin, Napa, Solano and Sonoma counties.
Air District and Aclima announce unprecedented, hyperlocal air quality data program
This initiative broadens the reach and impact of pioneering efforts across California in West Oakland, San Francisco, and San Diego. Most recently, through our work with West Oakland Environmental Indicators Project and the Rising Sun Center for Opportunity, we have generated and analyzed nearly 10 million data points on PM 2.5, ozone, carbon monoxide, carbon dioxide, nitric oxide and nitrogen dioxide levels. Insights from Aclima are already helping support and assess the impact of the recently adopted West Oakland Community Action Plan, which defines a new model for community-centered emission reduction plans.
To protect both human and planetary health, the time has come to take deep and systemic climate action, to design innovative policies, and to invent entirely new ways to understand and improve our environment. Through collaboration between local government, industry and community leaders, we can protect one of the most precious resources for life on Earth: the air we breathe.
By Davida Herzl, co-founder and CEO, Aclima
Share this
Driving Science
Sensing Wildfire Smoke at the Street Level