“At a time when millions of people are living in cities with poor air quality, mapping street-level pollution, block-by-block in real-time, provides an unprecedented tool for improving human and planetary health.”— Melissa Lunden, Chief Scientist at Aclima
Only 12% of people living in cities that measure and report on air quality reside in areas that meet World Health Organization air quality guidelines. Many areas, however, lack any form of air quality measurement. This means we don’t know the true scope of air pollution’s impact on human health in urban and rural areas around the world.
Today, Aclima’s mobile air quality measurement technology creates the opportunity to provide air pollution data to regions lacking measurement, providing access to information that has a large influence on our health. In addition, mobile measurements can provide a hyperlocal layer of environment intelligence in regions that have established air quality monitoring, highlighting areas of concern at the street-level. It is Aclima’s vision to bring this data equity and transparency to communities around the world.
To explore and illustrate how Aclima’s technology can provide insight into air quality questions and concerns, we partnered with Google Earth Outreach to map communities across California using two Street View cars equipped with Aclima’s environmental sensing platform.
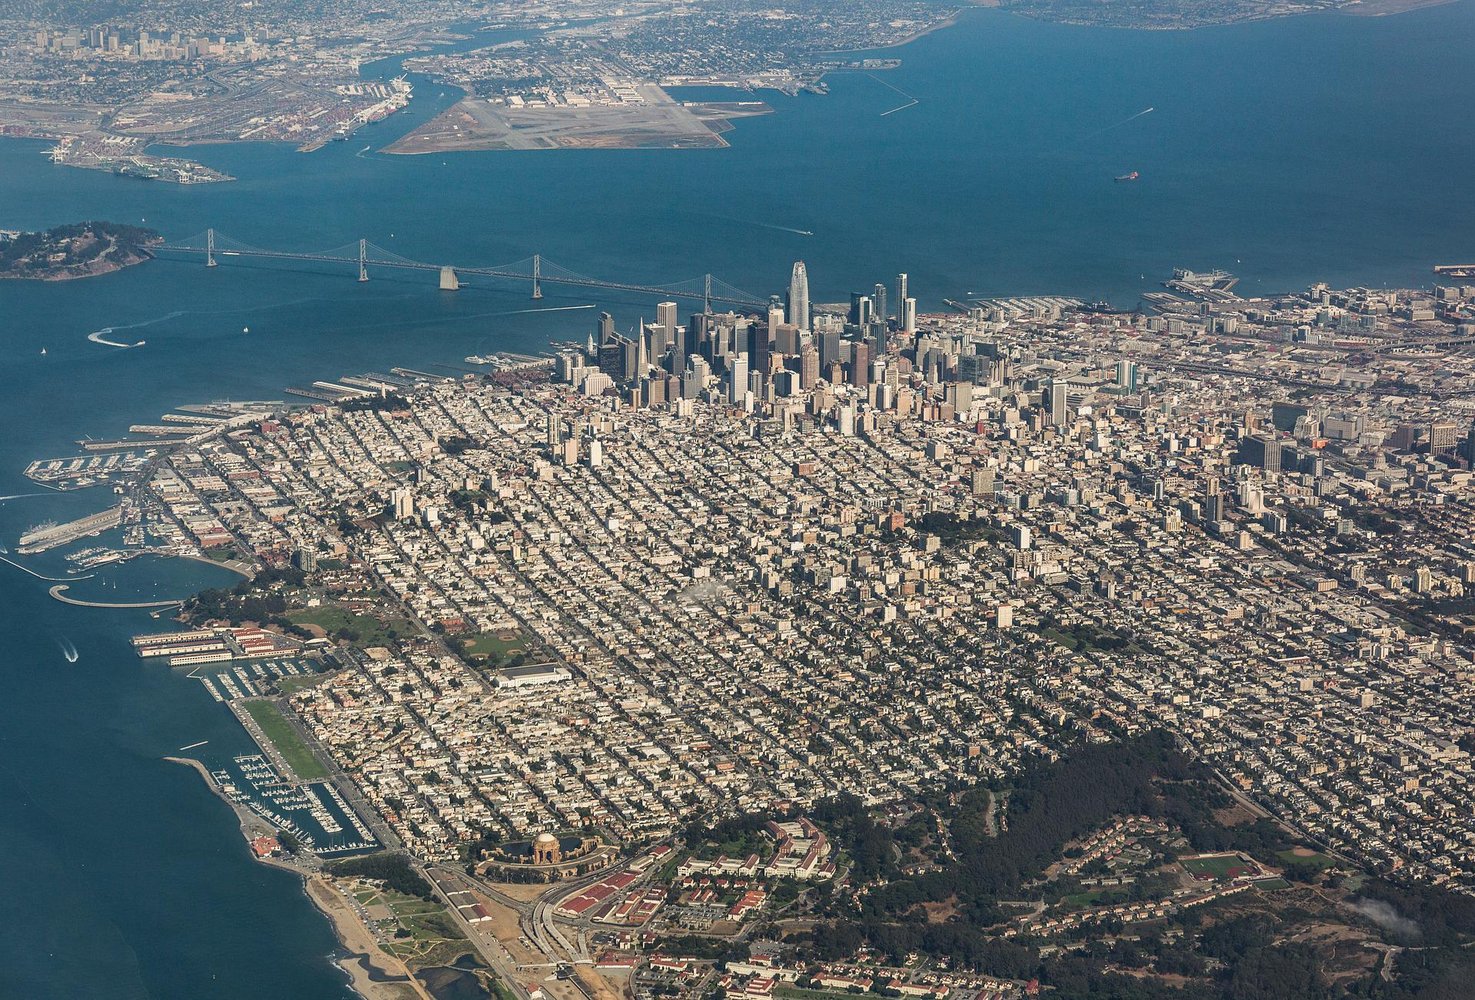
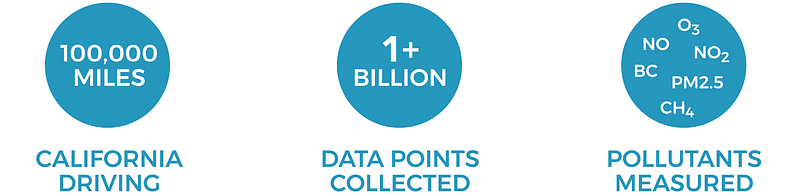
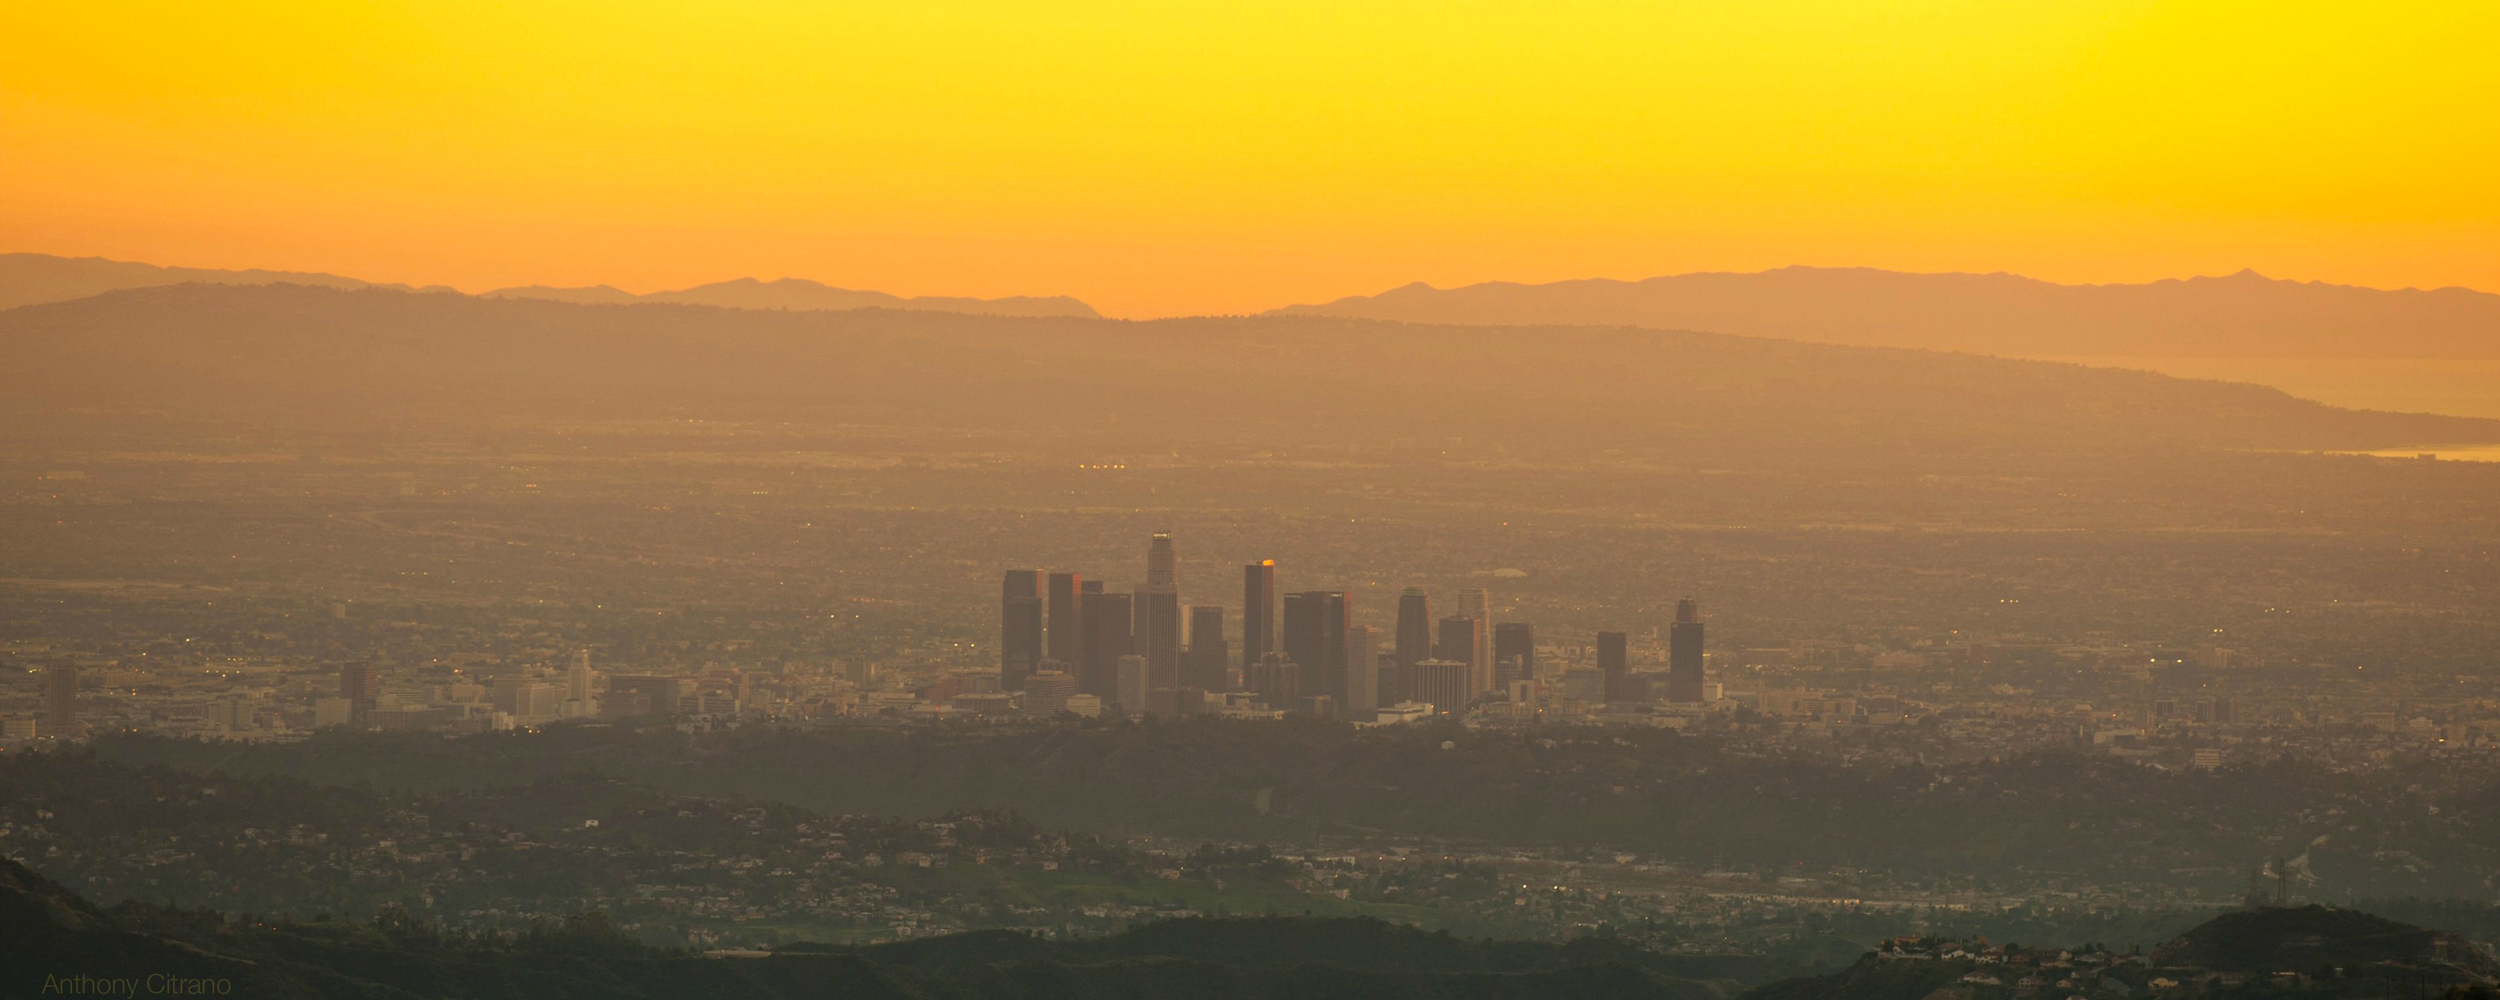
Over the course of 100,000 miles and 4,000 hours of driving from 2015 through 2017, we captured California’s air pollution with hyperlocal detail in three important regions — the San Francisco Bay Area, Los Angeles, and California’s Central Valley. Crisscrossing a city’s busiest arteries, intersections, and neighborhood streets enables us to see how levels of pollution change throughout a city over the course of a day, weeks, and months. Our insights provide better awareness of local air quality and can be used to find solutions that can help mitigate emissions and exposure to pollution.
California is one of the most populous states; home to 33 million people and millions of visitors who vacation here. A substantial fraction of air pollution in our state comes from combustion of fossil fuel that powers the state’s 39 million registered cars, trucks, trains, and other vehicles. Emissions from power plants, industrial and commercial processes, factories, and even fireplaces also contribute to the problem. Furthermore, California’s unique topography and its warm climate can create conditions that form and trap air pollutants. Most California cities are built in basins, whether situated on the coast or inland, or surrounded by mountains that prevent circulation and trap air pollution.
The hyperlocal air quality data made possible by our mobile platform will transform the way we make decisions about when to go for a run, which route we take to work, or how to prevent exposure to harmful air pollutants. As we begin to share this data with city, regional, and state decision-makers, we expect that this new layer of environmental intelligence can increase our understanding of how transportation, infrastructure, and urban planning impact air quality — from the street level to the city scape.
With Google Earth Outreach, we’ve amassed the largest data set of its kind about pollutants that most impact human health. In our California driving alone, we’ve surpassed one billion data points about our hyperlocal air quality. We can’t wait to share more with you.
How We Did It
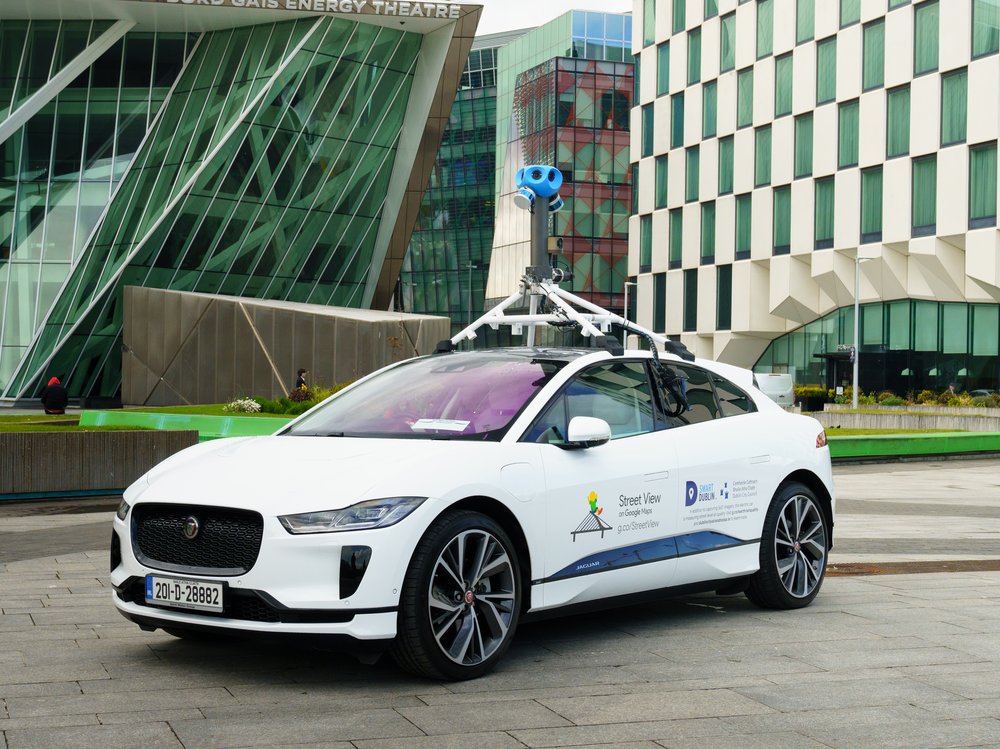
We equipped two Google Street View vehicles with Aclima’s mobile platform. The system includes data management, quality control, and visualization functions that enable the type of extensive routine air pollution data collection we performed in California. The cars drove from Monday through Friday during typical work hours of 9:00 am to 5:00 pm. We measured the pollutants nitrogen dioxide, nitric oxide, ozone, black carbon, particulate matter, and methane.
Learn More
Read about the unique features of Los Angeles, the Central Valley, and the San Francisco Bay Area — the three regions where we focused our mapping. Stay tuned as we post more stories and snapshots from our California driving.
Share this
Environmental Data to Empower Community-Driven Solutions
Celebrating 100 Million Measurements and Dublin Launch with Google Air View