No two cities are the same in terms of geography or air pollution sources. The air quality on any given day changes as often as the weather, and can vary block-by-block and neighborhood-by-neighborhood. Just as we often check the weather as part of preparing for the day, being able to check local air quality conditions can help us navigate the areas where we spend our time.
The San Francisco Bay Area is home to millions of people, and three major metropolitan areas — San Francisco, Oakland, and San Jose — with many communities and smaller cities quickly growing to accommodate the expected 8.5 million residents by 2030.
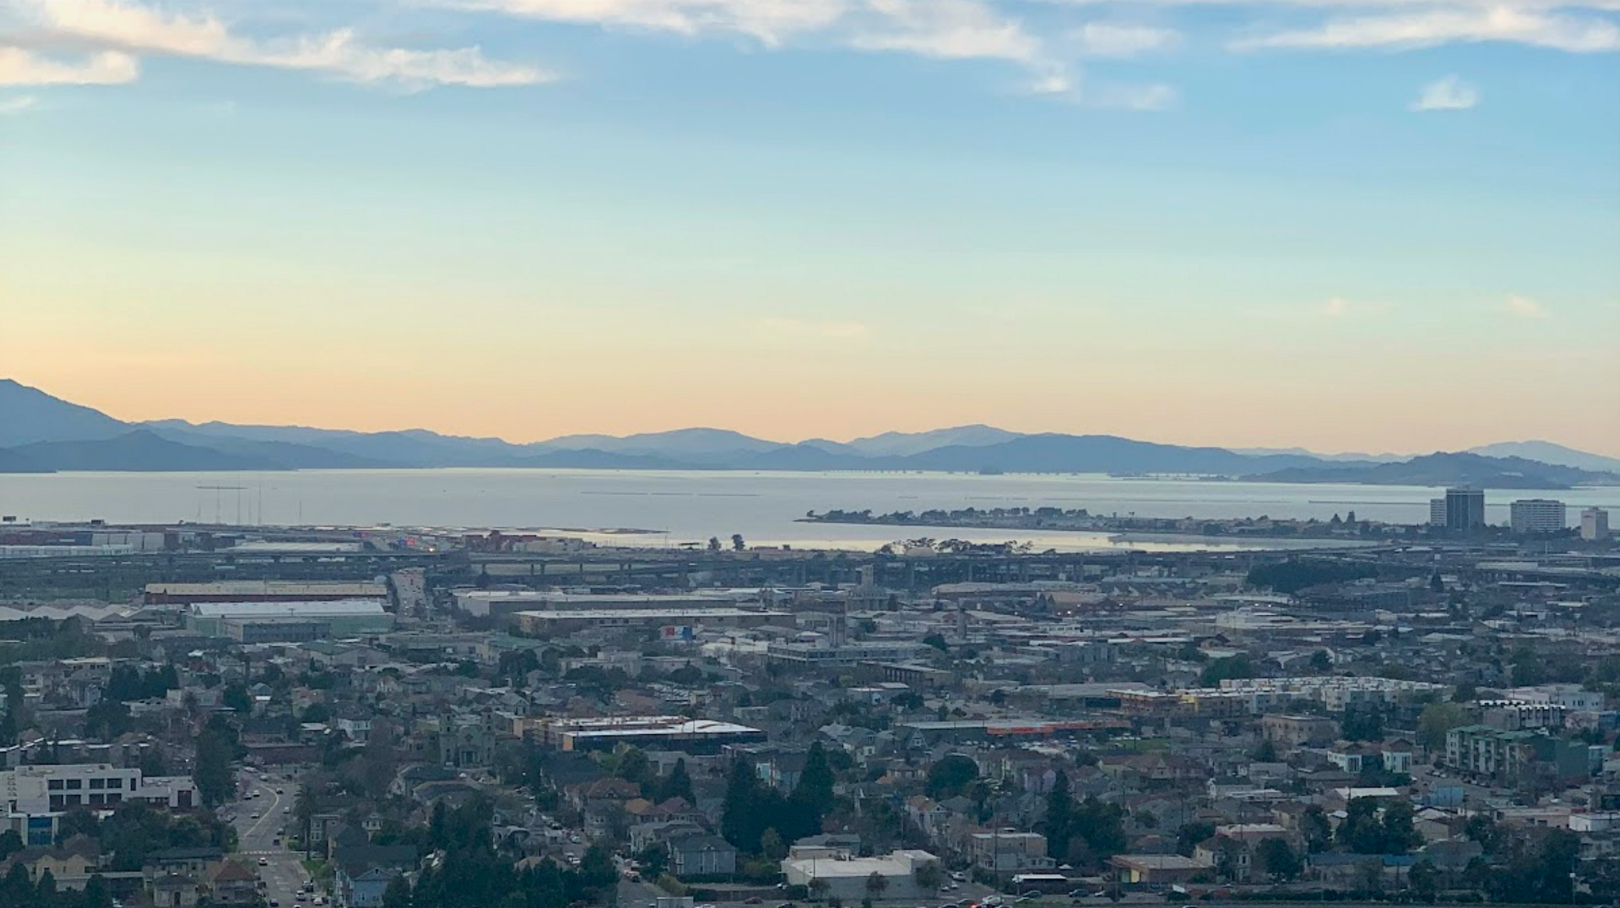
Compared to the sprawling County of Los Angeles, the San Francisco Bay Area has developed with higher density. The City of San Francisco alone packs 860,000 residents plus major businesses and commercial areas into just 49 square miles. A large percentage of air pollution emissions come from vehicles like cars, trucks, and construction equipment, even though many workers and students take mass transit to work. Industrial sources like refineries and power plants add to the mix in the region, resulting in the haze seen most prominently across the Bay in the mornings and evenings. Coastal winds regularly push the Bay Area’s air pollution inland where it can affect conditions in the Central Valley.
How We Did It
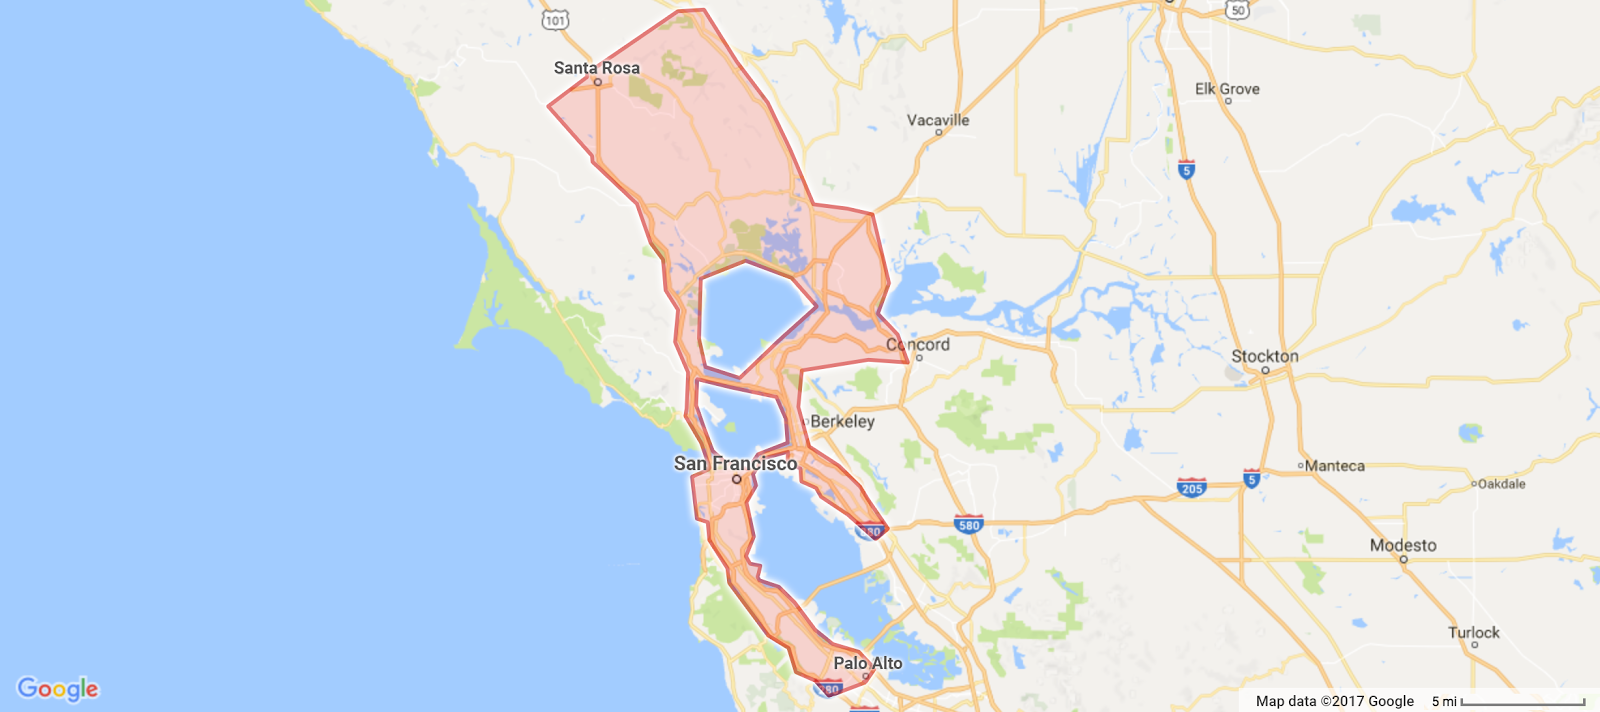
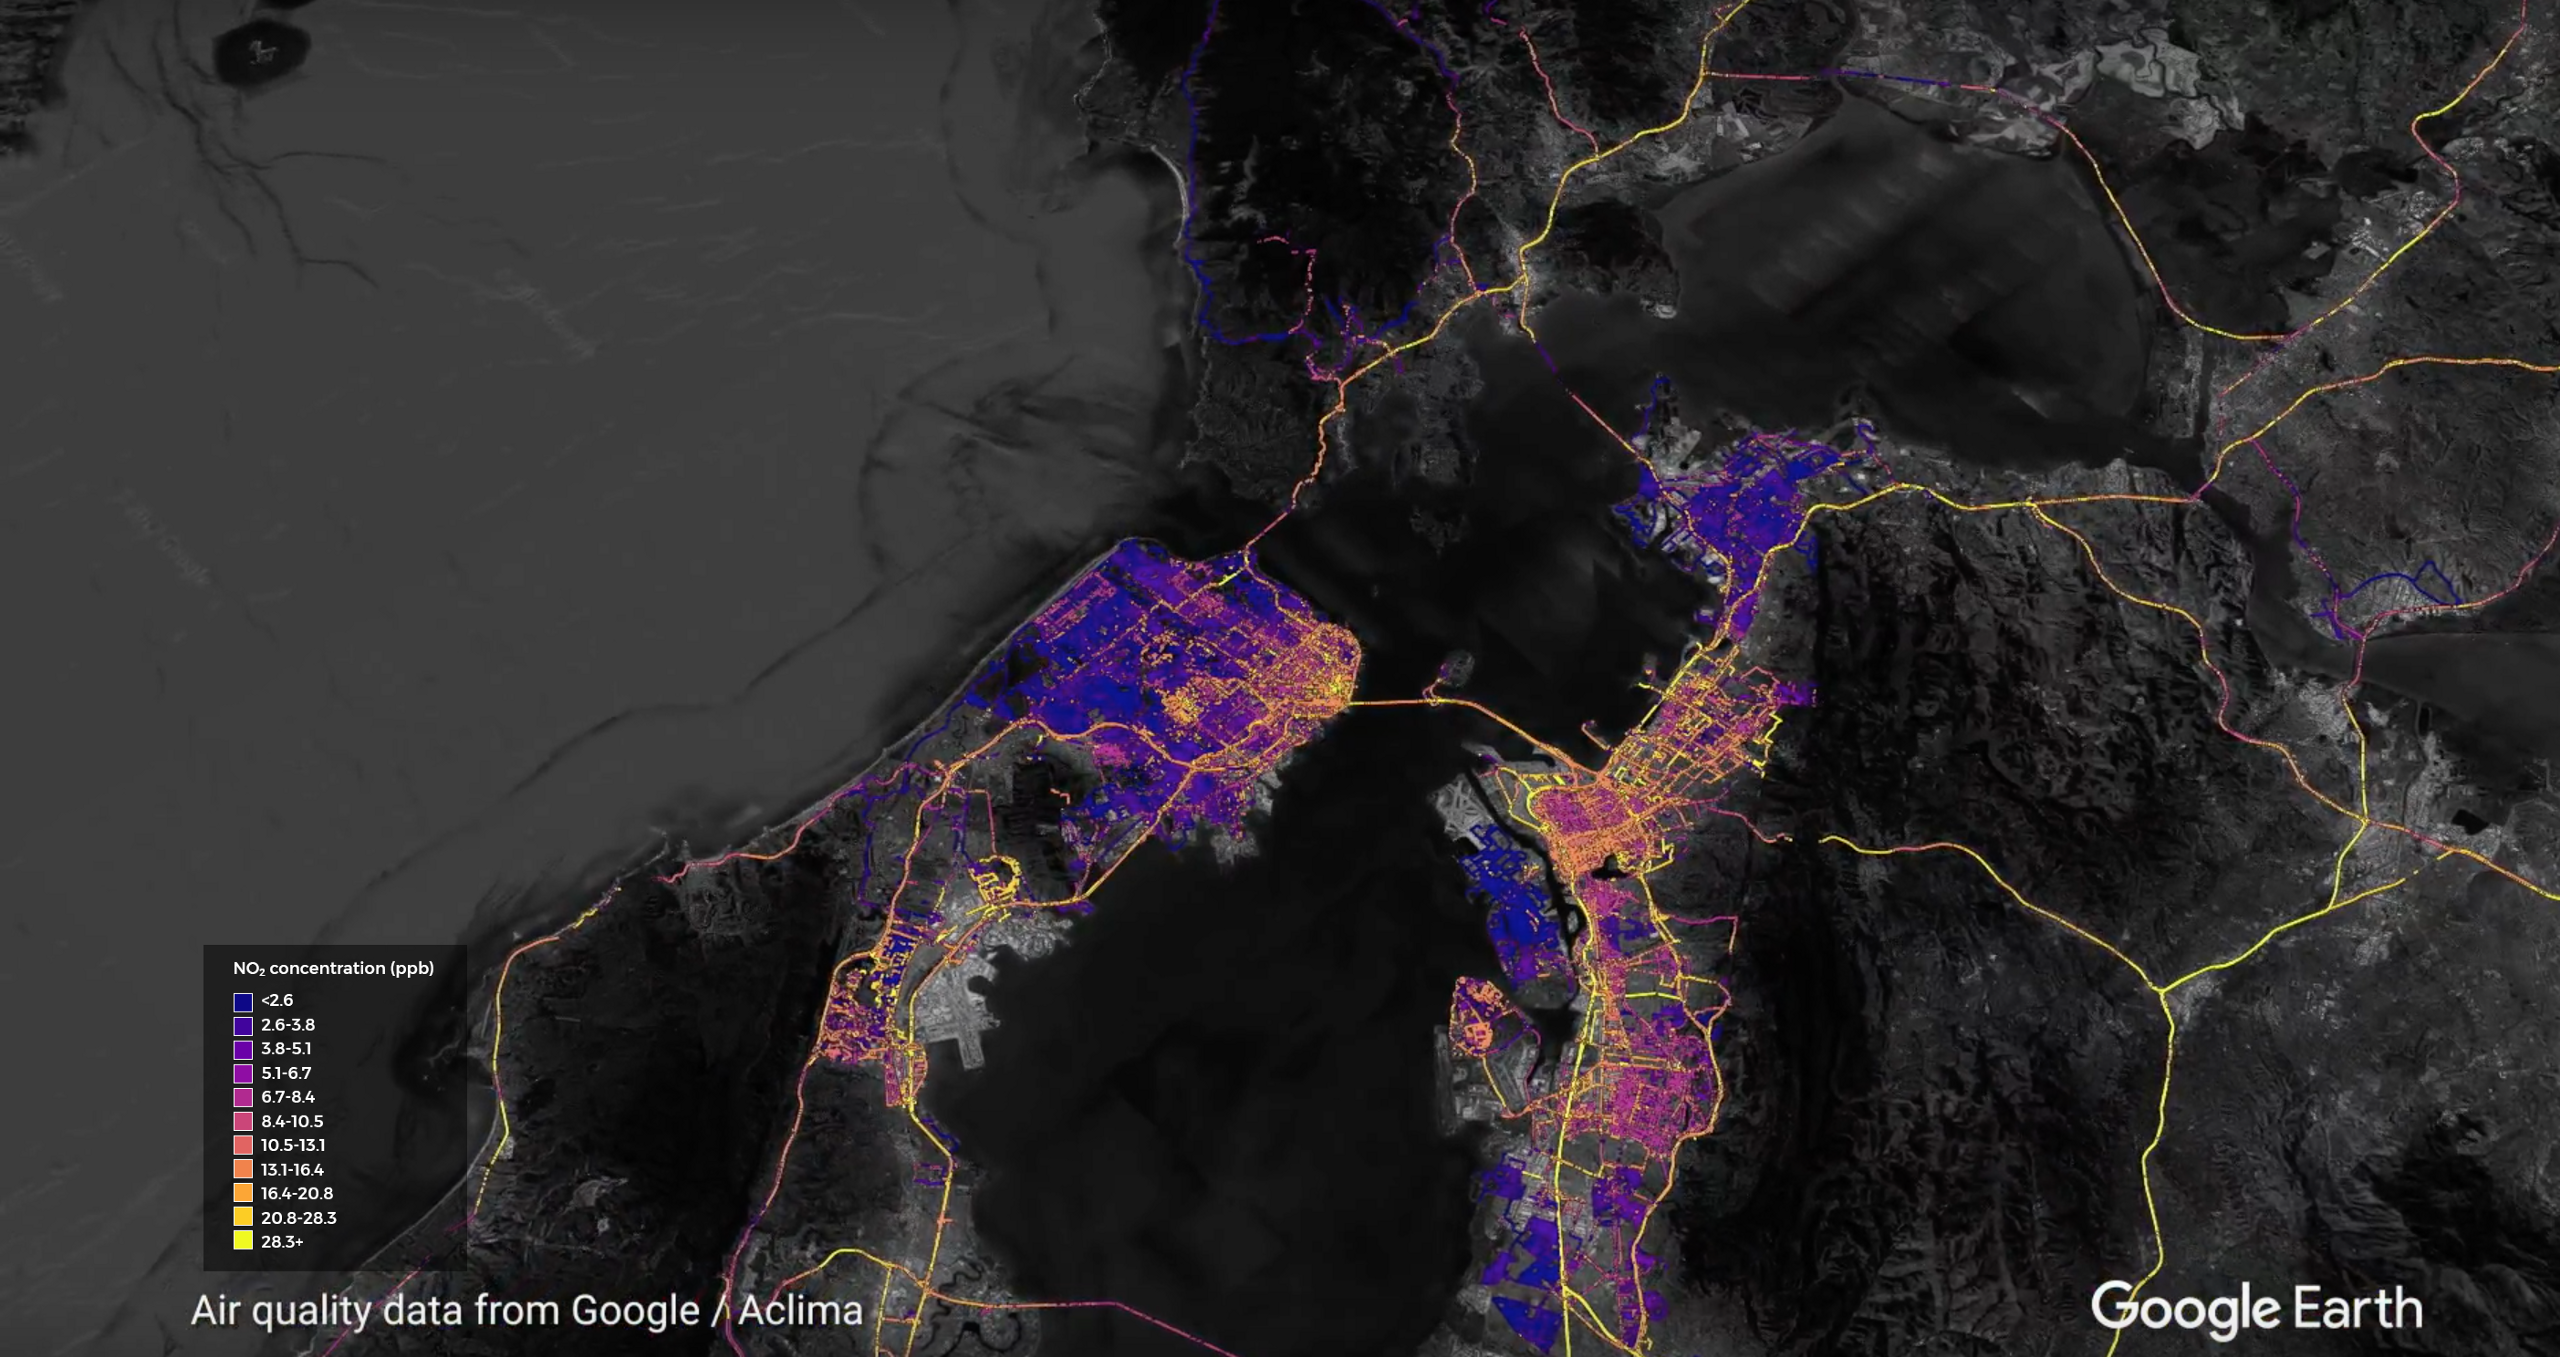
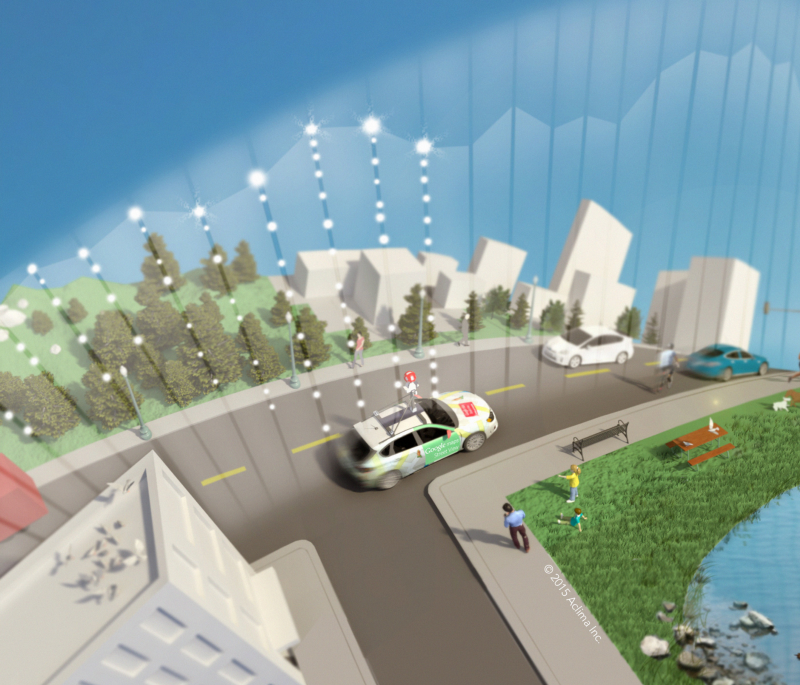
During the summer of 2016 and spring of 2017, we drove in the San Francisco Bay Area. Our primary focus was to map all of San Francisco by driving every street in the city. This approach complements research we completed in Oakland between May 2015 and June 2016 with the Environmental Defense Fund, Google, and the University of Texas to determine how often we need to canvass streets to collect representative data for use in support of air quality and exposure modeling. This project has since expanded geographically to mapping the larger Bay Area region. In addition, we performed targeted mobile measurements in areas throughout the greater Bay Area to explore specific sources, air pollution emission events, or to investigate specific science questions. The cars drove from Monday through Friday during typical work hours of 9:00 am to 5:00 pm. We measured the pollutants nitrogen dioxide, nitric oxide, ozone, black carbon, particulate matter, and methane.
Learn More
Stay tuned for data stories about these topics and read about why we decided to map these communities and how we did it.
Acknowledgements
We would like to thank the U.S. Environmental Protection Agency’s (EPA) Office of Research and Development, EPA’s Region 9 office, and the City of San Francisco’s Department of the Environment for advice and support during the Bay Area driving campaign.
Share this
Wine Country Wildfires
Aclima and Google Maps Make CGI Commitment to Map Air Pollution in Los Angeles and other California cities with Street View cars