Aclima, Google, and the Environmental Defense Fund map Oakland’s air quality
Aclima, Google, the Environmental Defense Fund (EDF), and engineering researchers from The University of Texas at Austin (UT Austin) announce today the results of a year-long study measuring and mapping air pollution in West Oakland to better understand the hyperlocal influence air pollution has on our health and our climate. The scale and scope of air quality measurement conducted in this study is unprecedented.
Traditional air quality measurement is achieved by stationary monitors, of which Oakland has three of the 15 located throughout the Bay Area. These stations are staffed and managed by the local Bay Area Air Quality Management District. Our approach fills in the gaps of traditional air monitoring and brings a new layer of environmental intelligence to individuals, communities, and cities by making air measurement mobile and local.
In a data-driven future, the environment must be represented. Solving urban air pollution requires systemic solutions driven by sound science and powered by big data. Thankfully, technology now makes it possible to fill in the gaps. By equipping Street View cars with Aclima’s sensing platform, we’ve unlocked a new paradigm for understanding our environment.
The Study
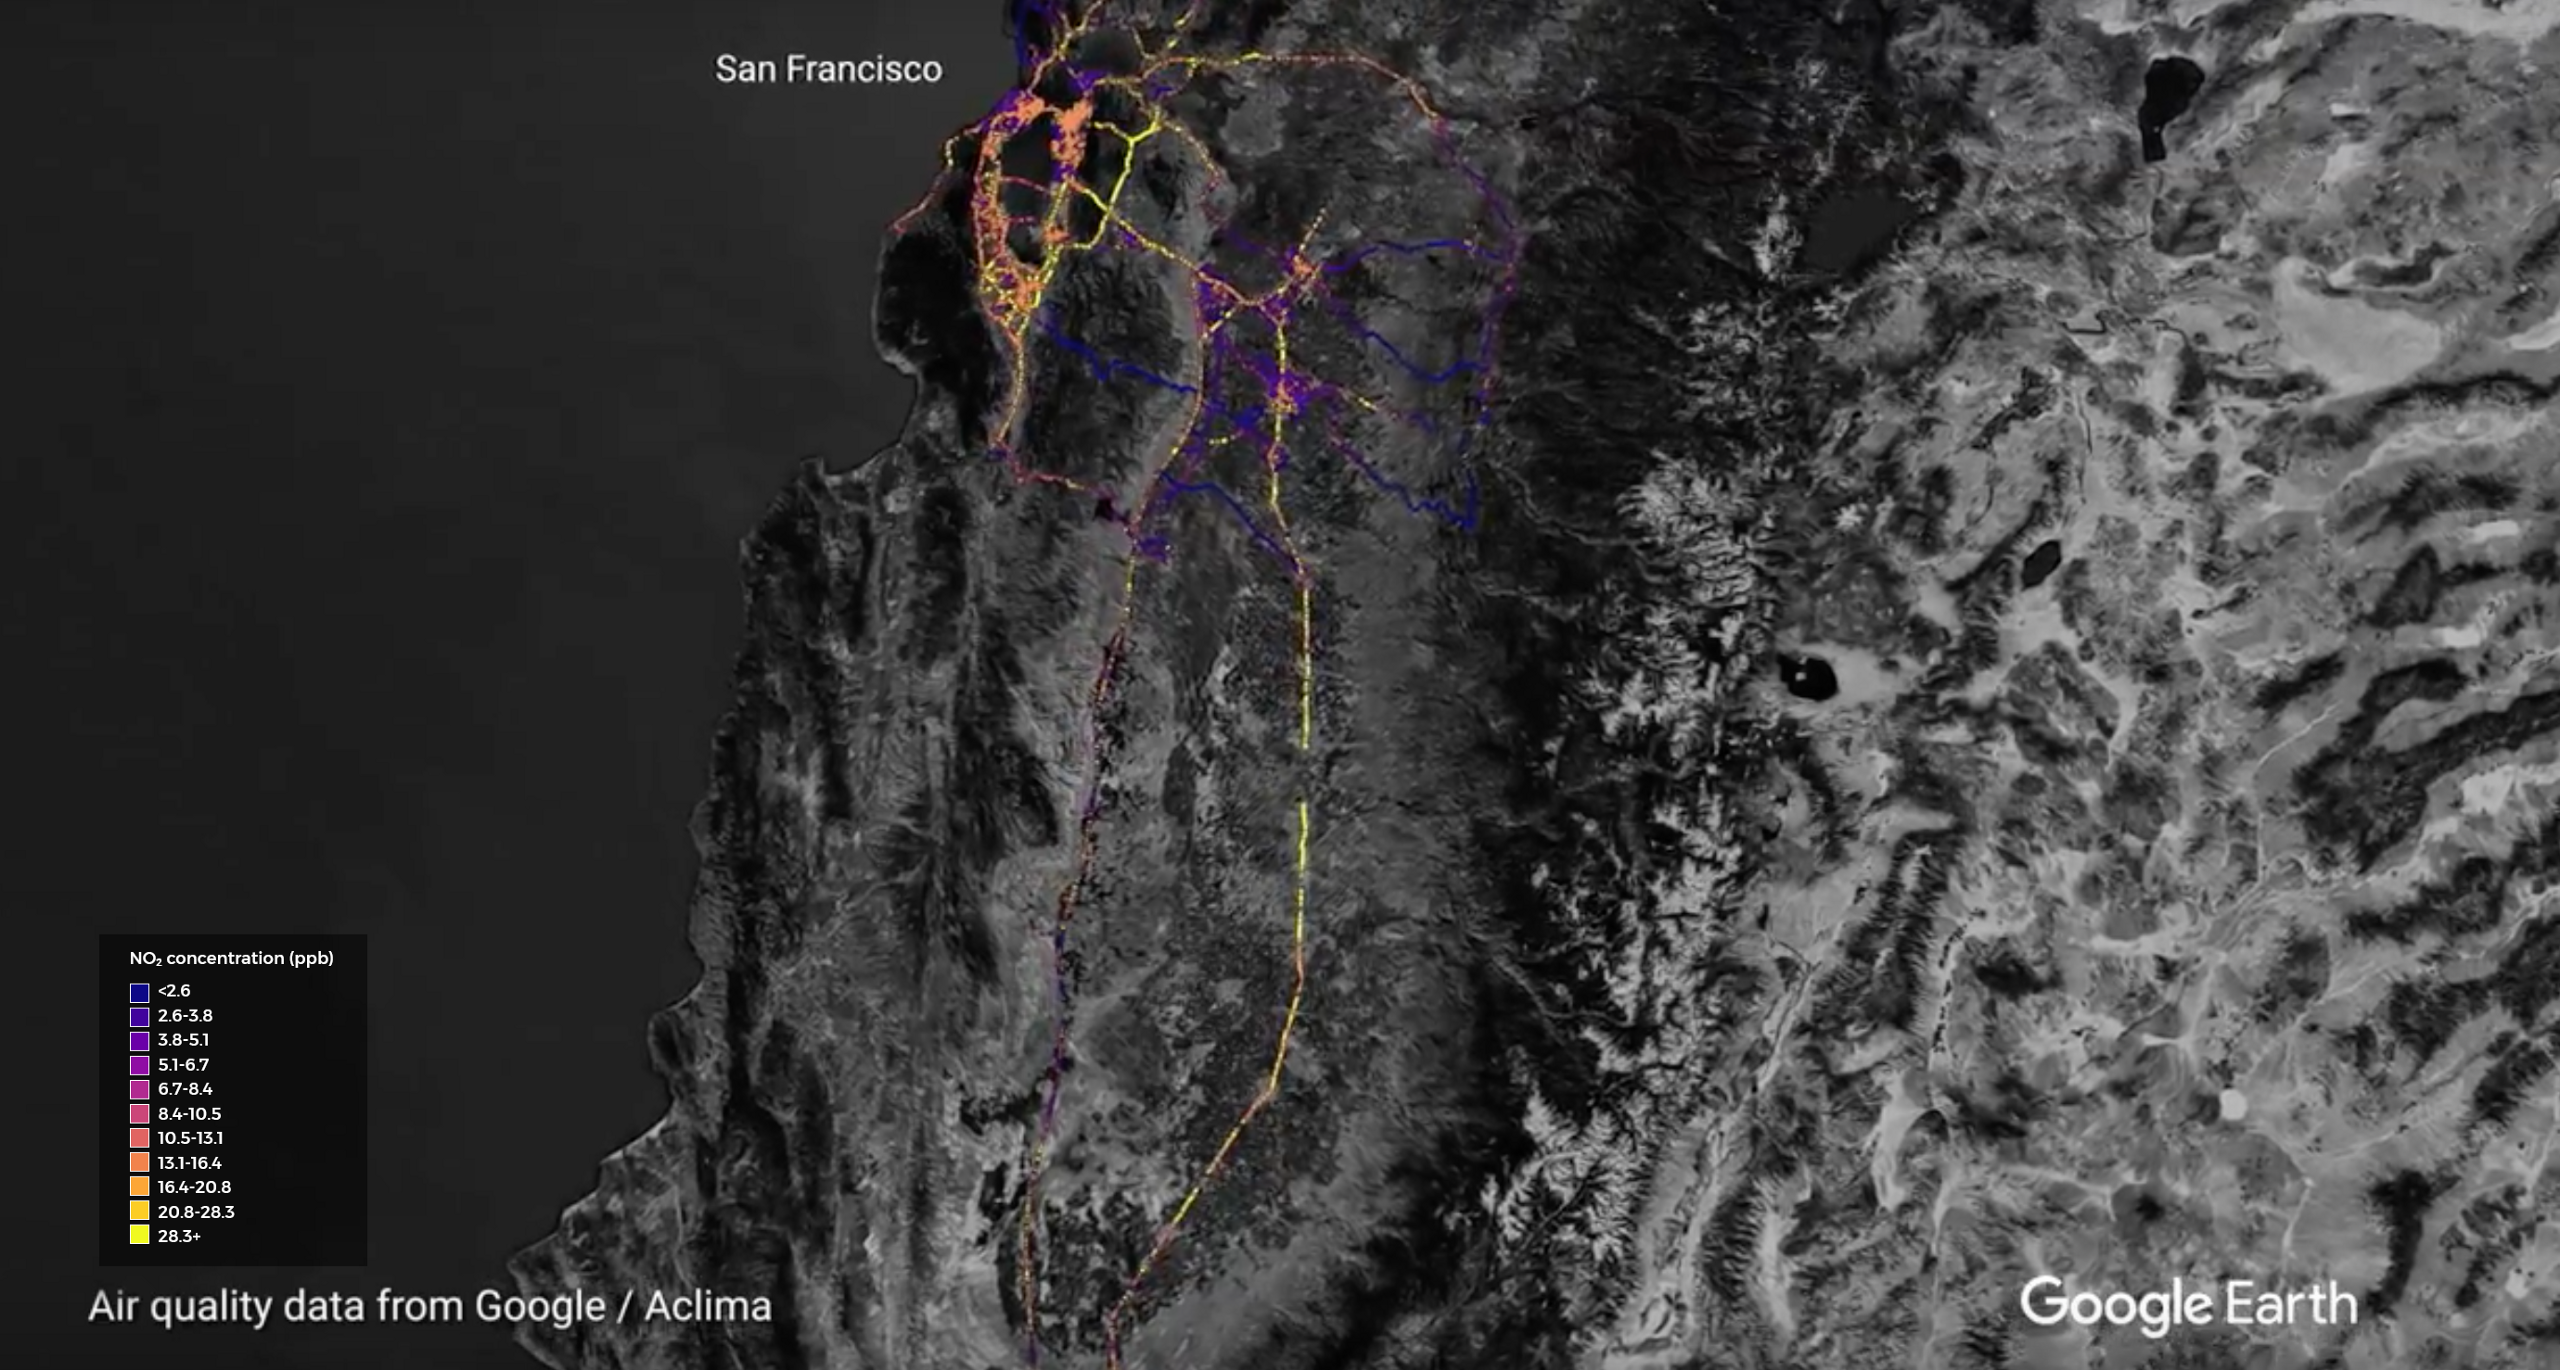
For this study, two Street View cars covered 14,000 miles and collected millions of data points about black carbon, nitric oxide, and nitrogen dioxide between May 2015 and May 2016. We chose to focus on these pollutants because they are known to be harmful to human and planetary health. Empowered with this new information, we will work with city officials and our local partners to discover insights and find solutions to alleviate pollution hot spots around the city.
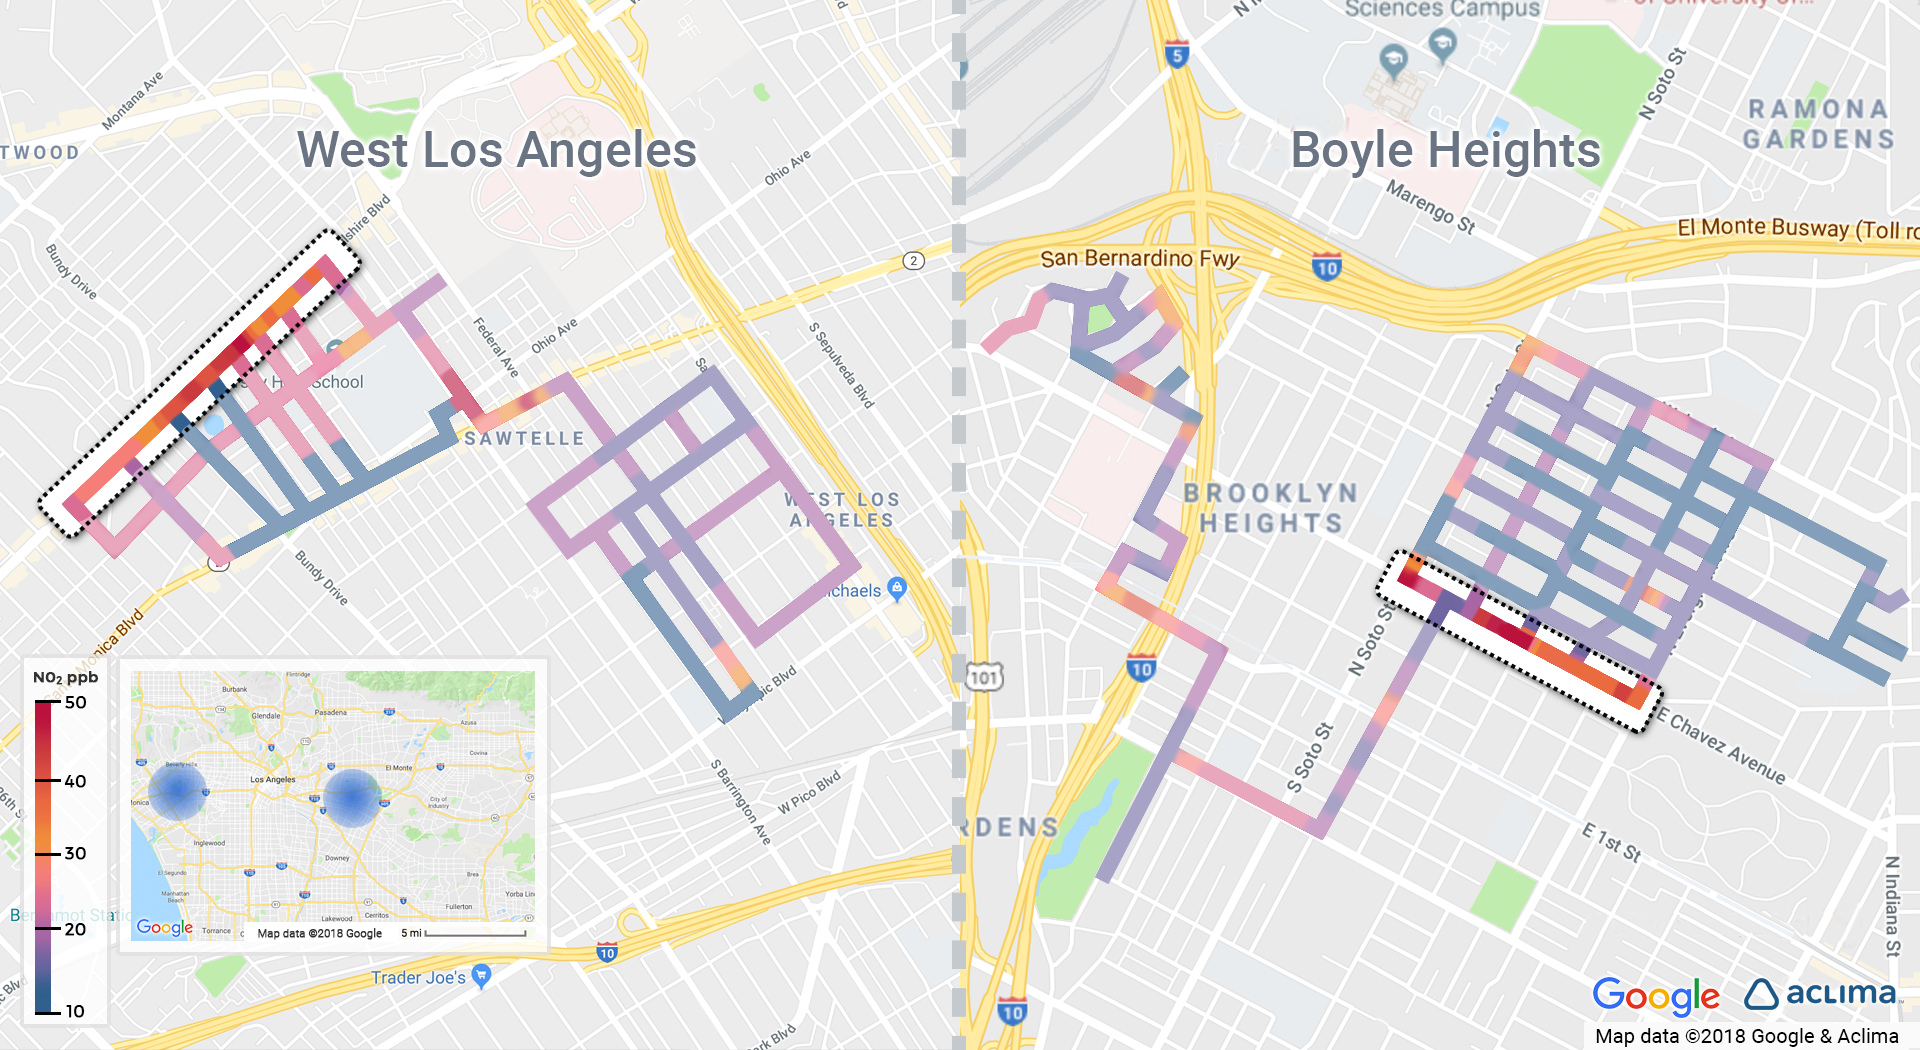
Our results — that urban air pollution can be highly variable over the length scale of city blocks — support the value of mobile measurement in mapping pollution at the street level. The resulting data set is one of the largest of its kind of single city streets. The work validates Aclima’s mobile measurement platform as a scalable approach to increase our understanding of the processes that define air pollution in our communities.
(Courtesy Aclima, Google)
The Problem
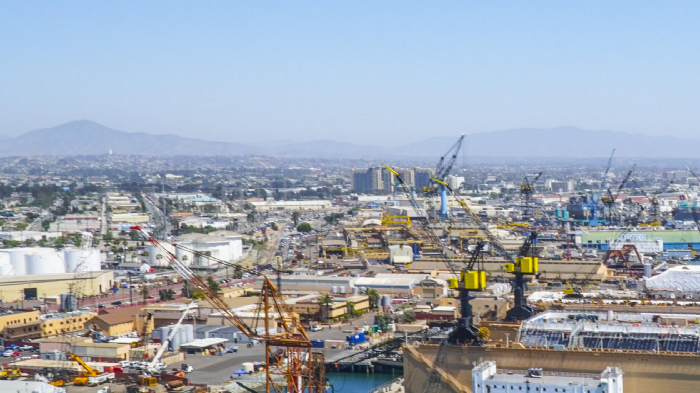
Oakland’s multiple busy freeway corridors and booming industrial shipping sector in the Port of Oakland generate high levels of air pollution. The I-880 freeway, which services Oakland and the surrounding Bay Area, carries the greatest volume of truck traffic in all of California. The data collected could help shape the way cities and communities develop, adapt, and mitigate pollution.
Results of our work demonstrate how decisions about transportation, zoning, and land use can have profound impacts on air quality and quality of life for residents, workers, and commuters. Unfortunately, the effects of this air pollution are already felt among Oakland’s population. In 2015, the overall rate of asthma emergency department visits for parts of East and West Oakland was two times the Alameda County rate. In Alameda County, the asthma hospitalization rate is nearly twice the state average and the third-highest in California. Today, more than a quarter of a million children suffer from asthma in Alameda County, where Oakland is located.
“At a time when millions of people are living in cities with poor air quality, mapping street-level pollution, block-by-block in real-time, provides an unprecedented tool for improving human and planetary health. Our sensing platform is a scalable solution to address major air quality monitoring gaps worldwide,” said Melissa Lunden, Chief Scientist at Aclima.

The Solution
With this transformative technology, we hope to enable more people to join local, regional, and national dialogues on improvements to our air quality. We are already sharing the data with air quality scientists and our research partners at the U.S. Environmental Protection Agency. Our shared vision is to create a community of partners in scientific, business, governmental, and regulatory communities to apply the insights generated by Aclima’s sensing platform to improve health in our communities.
Our next steps are to scale this effort and bring large-scale, ubiquitous pollution mapping to other cities. In September 2015, we made a commitment with Google to expand our mobile sensing to communities in Los Angeles, San Francisco, and the Central Valley and are measuring many more pollutants. So far, we’ve driven more than 80,000 miles together in California and we plan to share data and insights from that work in the coming months.
Share this
Healthier Cities Through Data
How Traffic Affects Your Short-Term Pollution Exposure